About this page
This consolidated page combines the full West Gate Bridge statistical output with the additional early tunnel-impact findings, truck-share analysis and first corridor-level sensor work.
Generated at: 2026-03-19 14:17:55
The database contains 132,389,534 rows across 6 tables, with raw TIRTL coverage from 2025-11-01 to 2026-03-15. The raw network spans 302 distinct sites.
The bridge-focused table contains 25,767 fifteen-minute bridge observations. Average bridge load is 3,750.7 vehicles/hour, with a maximum observed bridge flow of 10,484 vehicles/hour. Average observed speed is 67.9 km/h, but the minimum drops to 13.8 km/h, indicating clear stress periods.
Early comparison work also suggests weekday bridge traffic fell from 192,875.2 to 178,502.2 vehicles/day after the opening split, the weekday inbound 7am–9am peak eased, and the first validated South Wharf / ramp-adjacent sensors showed modest overall reductions with stronger softening at selected peak hours.
Top-line reading:
The strongest evidence currently available points to partial easing and redistribution rather than a dramatic collapse in demand: the bridge remains heavily used, but the weekday inbound peak and some nearby corridor pressure appear to have softened in the early operating period.
This page is a single consolidated public reference for the website. All figures are computed directly from raw TIRTL data without manual adjustment, then assembled into one page for easier review when media coverage goes live.
5 Key Takeaways
- The West Gate Bridge remains one of Melbourne’s heaviest-used road corridors even after the early tunnel-opening changes.
- Average weekday bridge traffic is lower in the current comparison window, but demand has clearly shifted rather than vanished.
- The clearest early improvement appears in the weekday inbound morning peak, where speeds improved and flow softened.
- Truck share and selected nearby corridor sensors also point to partial redistribution of pressure across the wider network.
- The current evidence supports a story of easing and rebalancing, not a dramatic emptying of the bridge.
Why This Matters to Melbourne Drivers
For ordinary drivers, this analysis matters because it moves the conversation beyond vague claims and into measured reality.
It helps answer practical questions people care about: whether the bridge is genuinely less crowded, whether morning trips are improving,
whether trucks have shifted, and whether congestion has eased on nearby approaches rather than simply moving from one choke point to another.
In simple terms, the current data suggests the West Gate Tunnel has already had some real effect, especially at selected peak periods,
but the West Gate Bridge is still under heavy structural demand. That means Melbourne drivers may benefit from some relief,
but should not expect the corridor to suddenly behave like a lightly used road. The bridge still matters enormously,
and ongoing data monitoring is essential to show whether early improvements strengthen, plateau, or fade over time.
Executive Summary
Key findings from current analysis:
- Average weekday bridge traffic reduced by 14,373 vehicles/day following the tunnel opening comparison split.
- Morning inbound peak speeds improved from 46.4 km/h to 55.1 km/h.
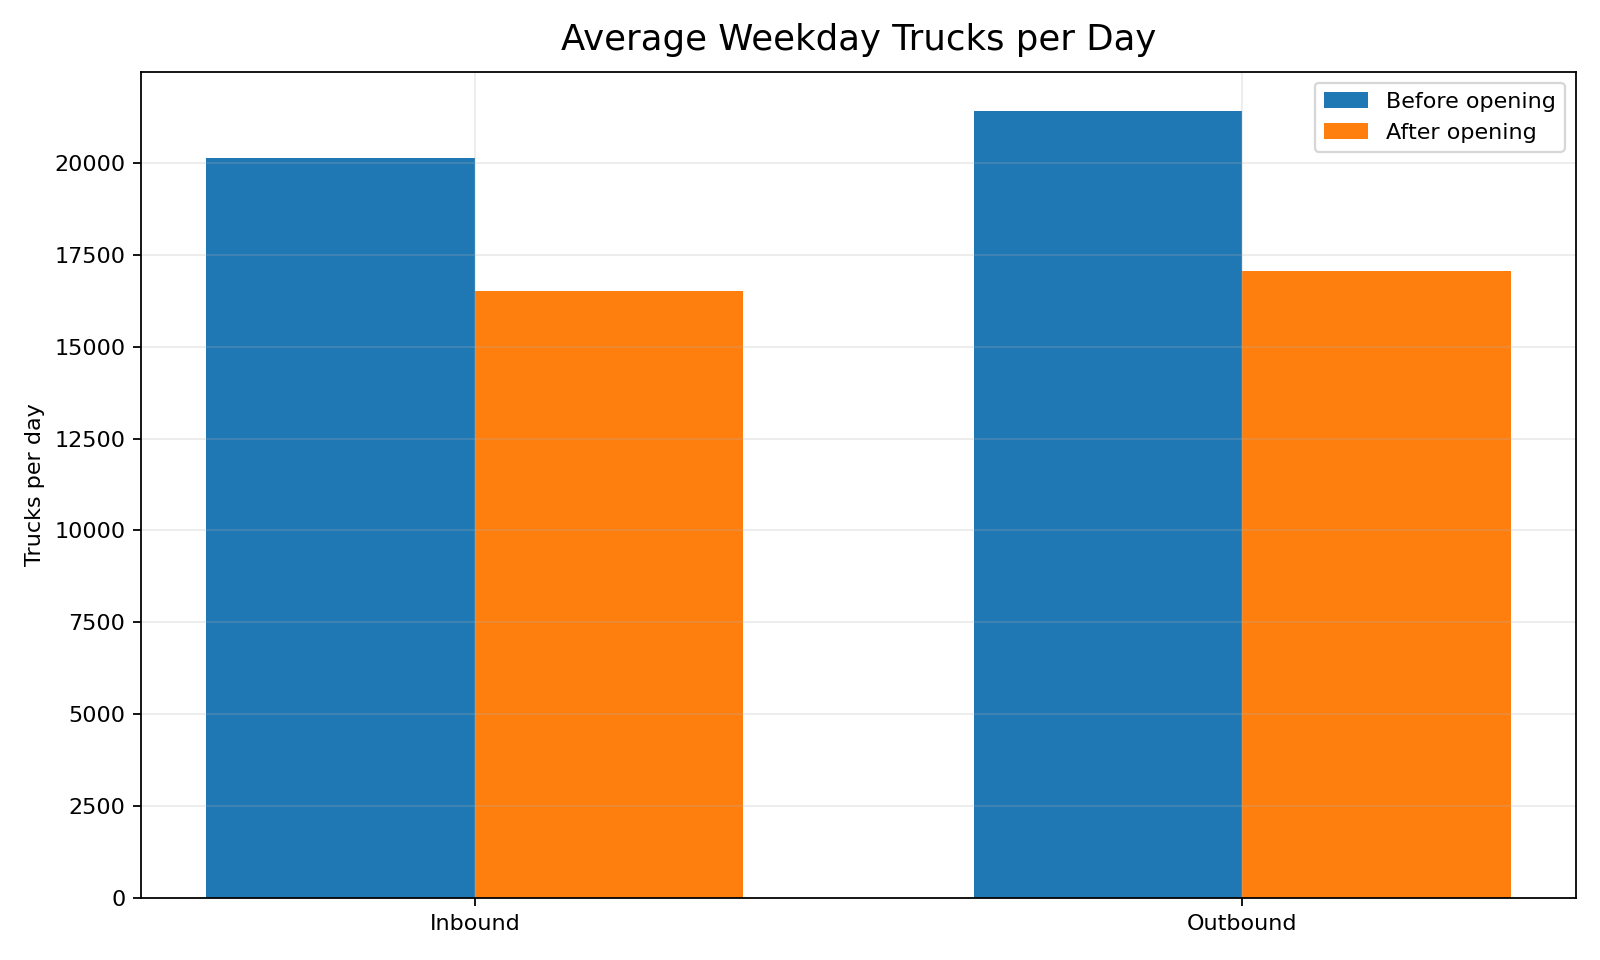
- Inbound truck share declined from 21.33% to 18.80%.
- Key corridor sensors recorded reductions of approximately 5–7%.
- Peak congestion periods softened, but bridge demand remains structurally strong.
Overall, the available data points to redistribution rather than collapse of demand.
The West Gate Bridge remains one of Melbourne's most heavily used transport corridors, even after the early tunnel-opening changes visible in this dataset.
Data Currency
Dataset coverage: 2025-11-01 to 2026-03-15
Latest raw data date: 2026-03-15
Page last generated: 2026-03-19 14:17:55
This page can be regenerated as additional sensor data becomes available.
What These Results Suggest
Interpreting the statistical findings in practical corridor terms.
- Traffic demand has shifted, not disappeared.
- The tunnel appears to have introduced measurable redistribution across the wider corridor.
- The weekday morning inbound peak shows the clearest early relief.
- Bridge utilisation remains structurally high despite the observed reductions.
- Congestion behaviour still reflects broader feeder-road pressure, not just one isolated bottleneck.
These early results suggest that major infrastructure changes may soften peak behaviour before producing very large absolute reductions in total daily traffic.
Data Confidence and Limitations
- The analysis period currently spans November 2025 to March 2026.
- The tunnel comparison reflects an early operating window, not a mature long-run equilibrium.
- Some corridor locations remain without full sensor coverage.
- Seasonal conditions and summer travel patterns may influence part of the early signal.
- Stronger long-term conclusions will require continued monitoring over additional quarters.
All calculations are derived directly from raw TIRTL data using automated processing methods. No manual smoothing or hand adjustment has been applied to the headline metrics shown on this page.
System Architecture Overview
High-level outline of how the statistical outputs on this page were produced.
- Raw TIRTL data ingestion pipeline.
- Structured database architecture for bridge and corridor analysis.
- Baseline modelling using time-of-day and day-of-week comparison logic.
- Automated aggregation into daily, hourly and peak-window summaries.
- Script-driven chart generation and public-page assembly.
- Repeatable regeneration workflow as new data becomes available.
The workflow is designed to support transparent, repeatable updates rather than one-off manual analysis.
Headline Metrics
Total Database Rows
132,389,534
Peak Bridge Flow
10,484 veh/hr
Average Bridge Speed
67.9 km/h
Minimum Recorded Speed
13.8 km/h
Average Baseline Delta
-0.0%
Bridge Weekday Change
-14,373/day
Inbound 7–9am Speed
46.4 → 55.1 km/h
Inbound 7–9am Flow
6,281 → 5,962 vph
Inbound Truck Share
21.33% → 18.80%
Corridor Sensors
504 and 505
Largest Peak Reduction
~19%
Visual Analysis
These charts translate the raw West Gate Bridge statistics into visual form, making the daily traffic rhythm,
speed behaviour, anomaly frequency and feeder-corridor pressure easier to interpret at a glance.
Quick visual takeaway: the charts show a corridor under sustained daily pressure, with a strong
morning inbound wave, a stronger afternoon outbound wave, meaningful divergence from historical norms, and
clear evidence that feeder-road demand contributes materially to bridge stress.
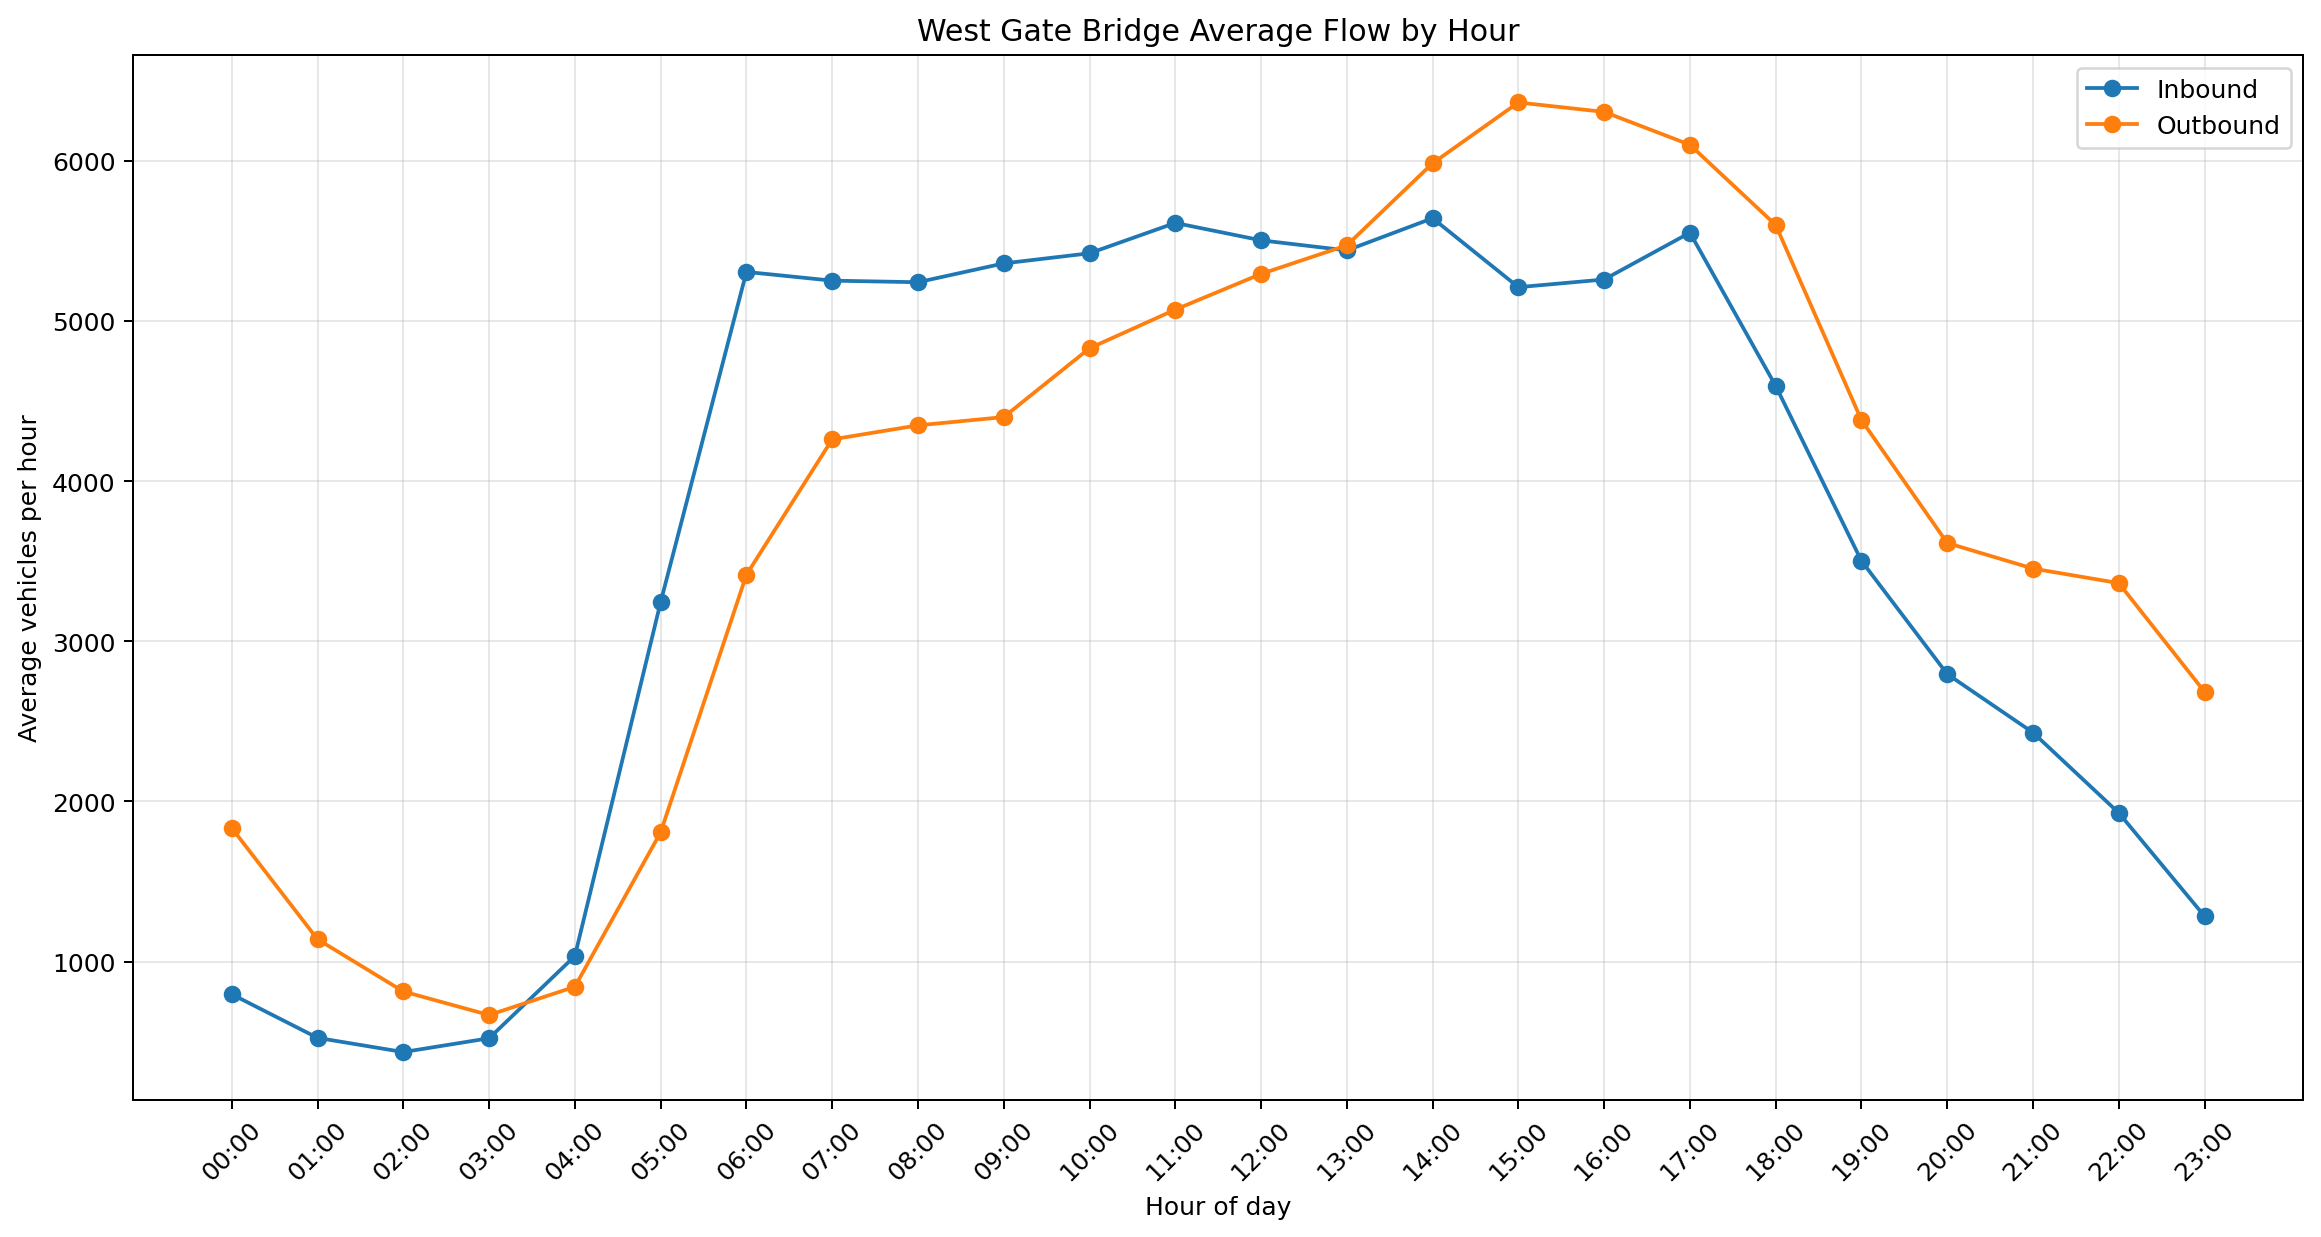
Hourly Average Flow by Direction
Shows the daily traffic shape of the bridge. Inbound pressure dominates the morning commute,
while outbound pressure becomes strongest through the afternoon and evening.
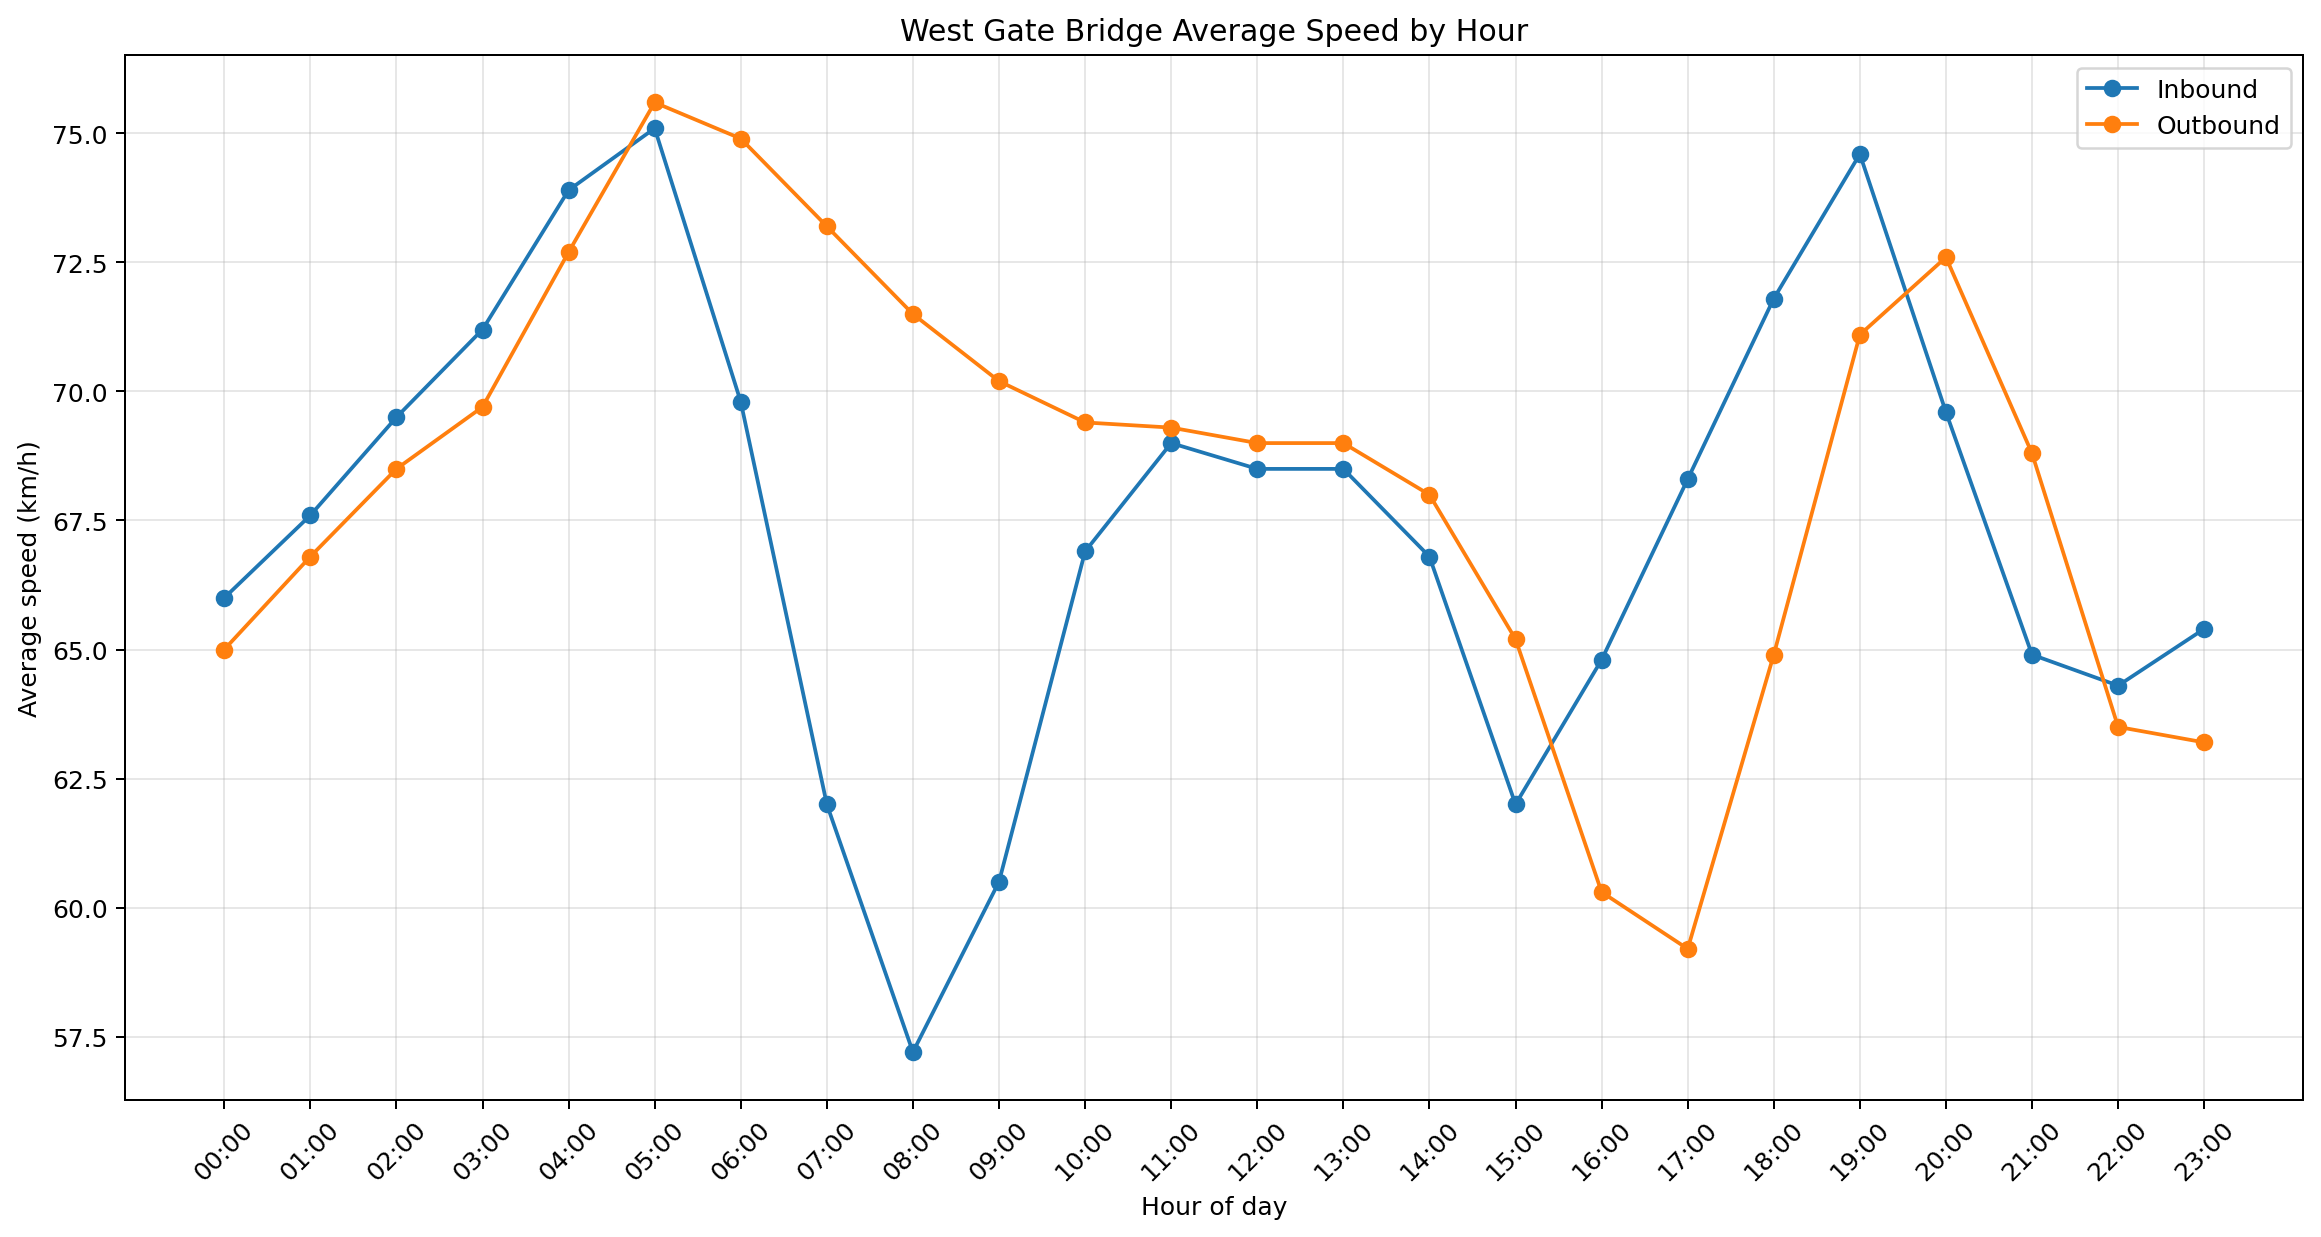
Hourly Average Speed by Direction
Shows how speed changes through the day. The chart makes the morning inbound slowdown and
afternoon outbound speed deterioration immediately visible.
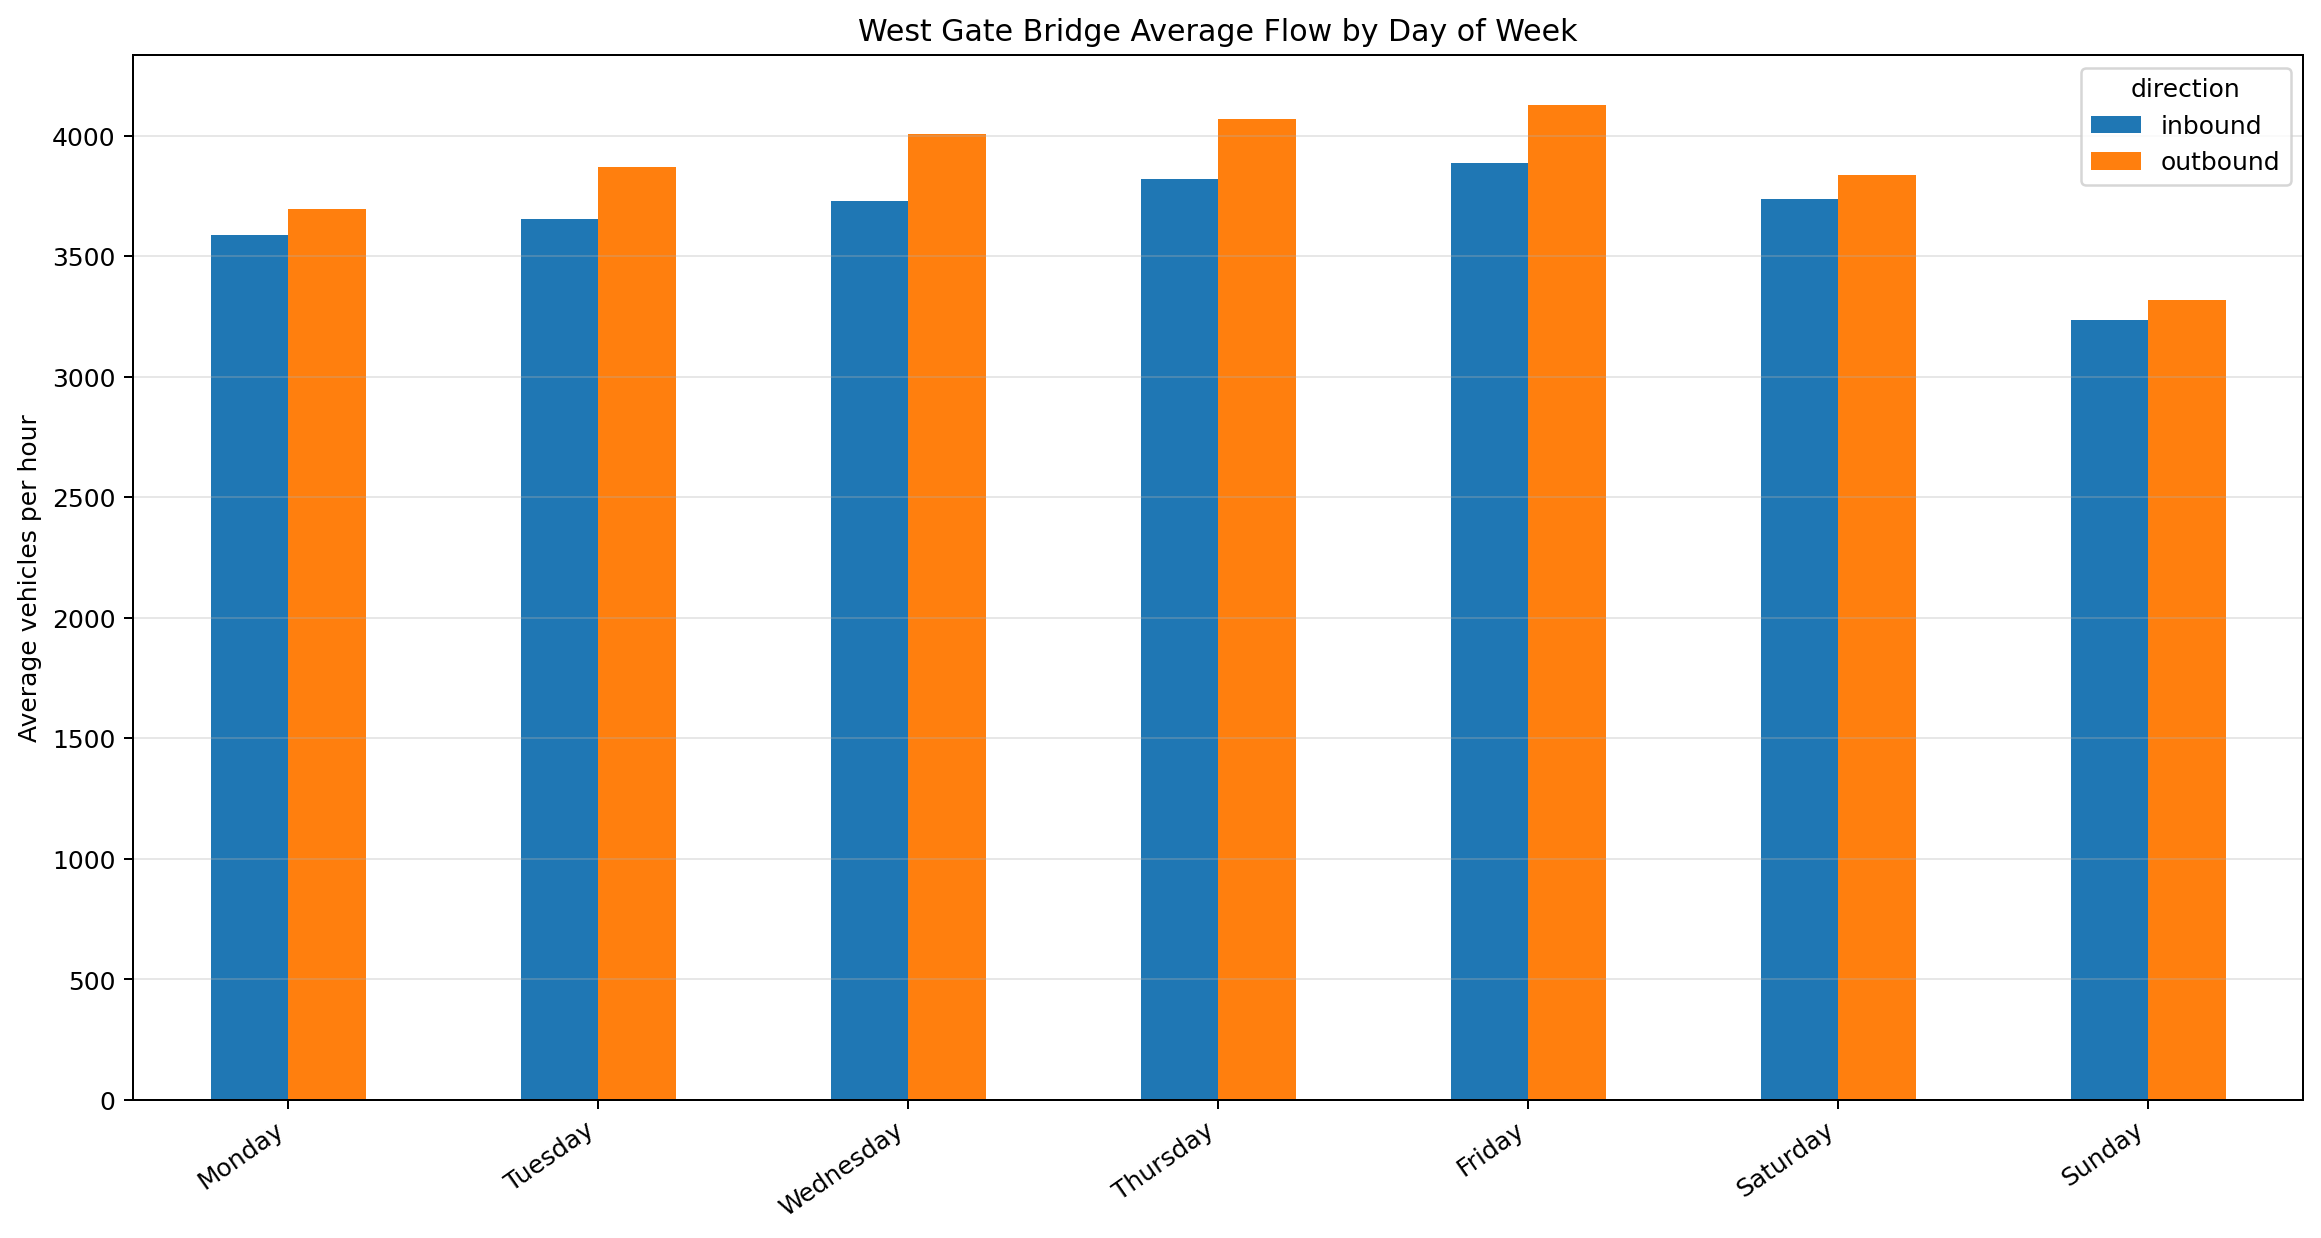
Average Flow by Day of Week
Confirms that weekday conditions are generally heavier than weekends, with Friday emerging as
the strongest regular weekday in both directions.
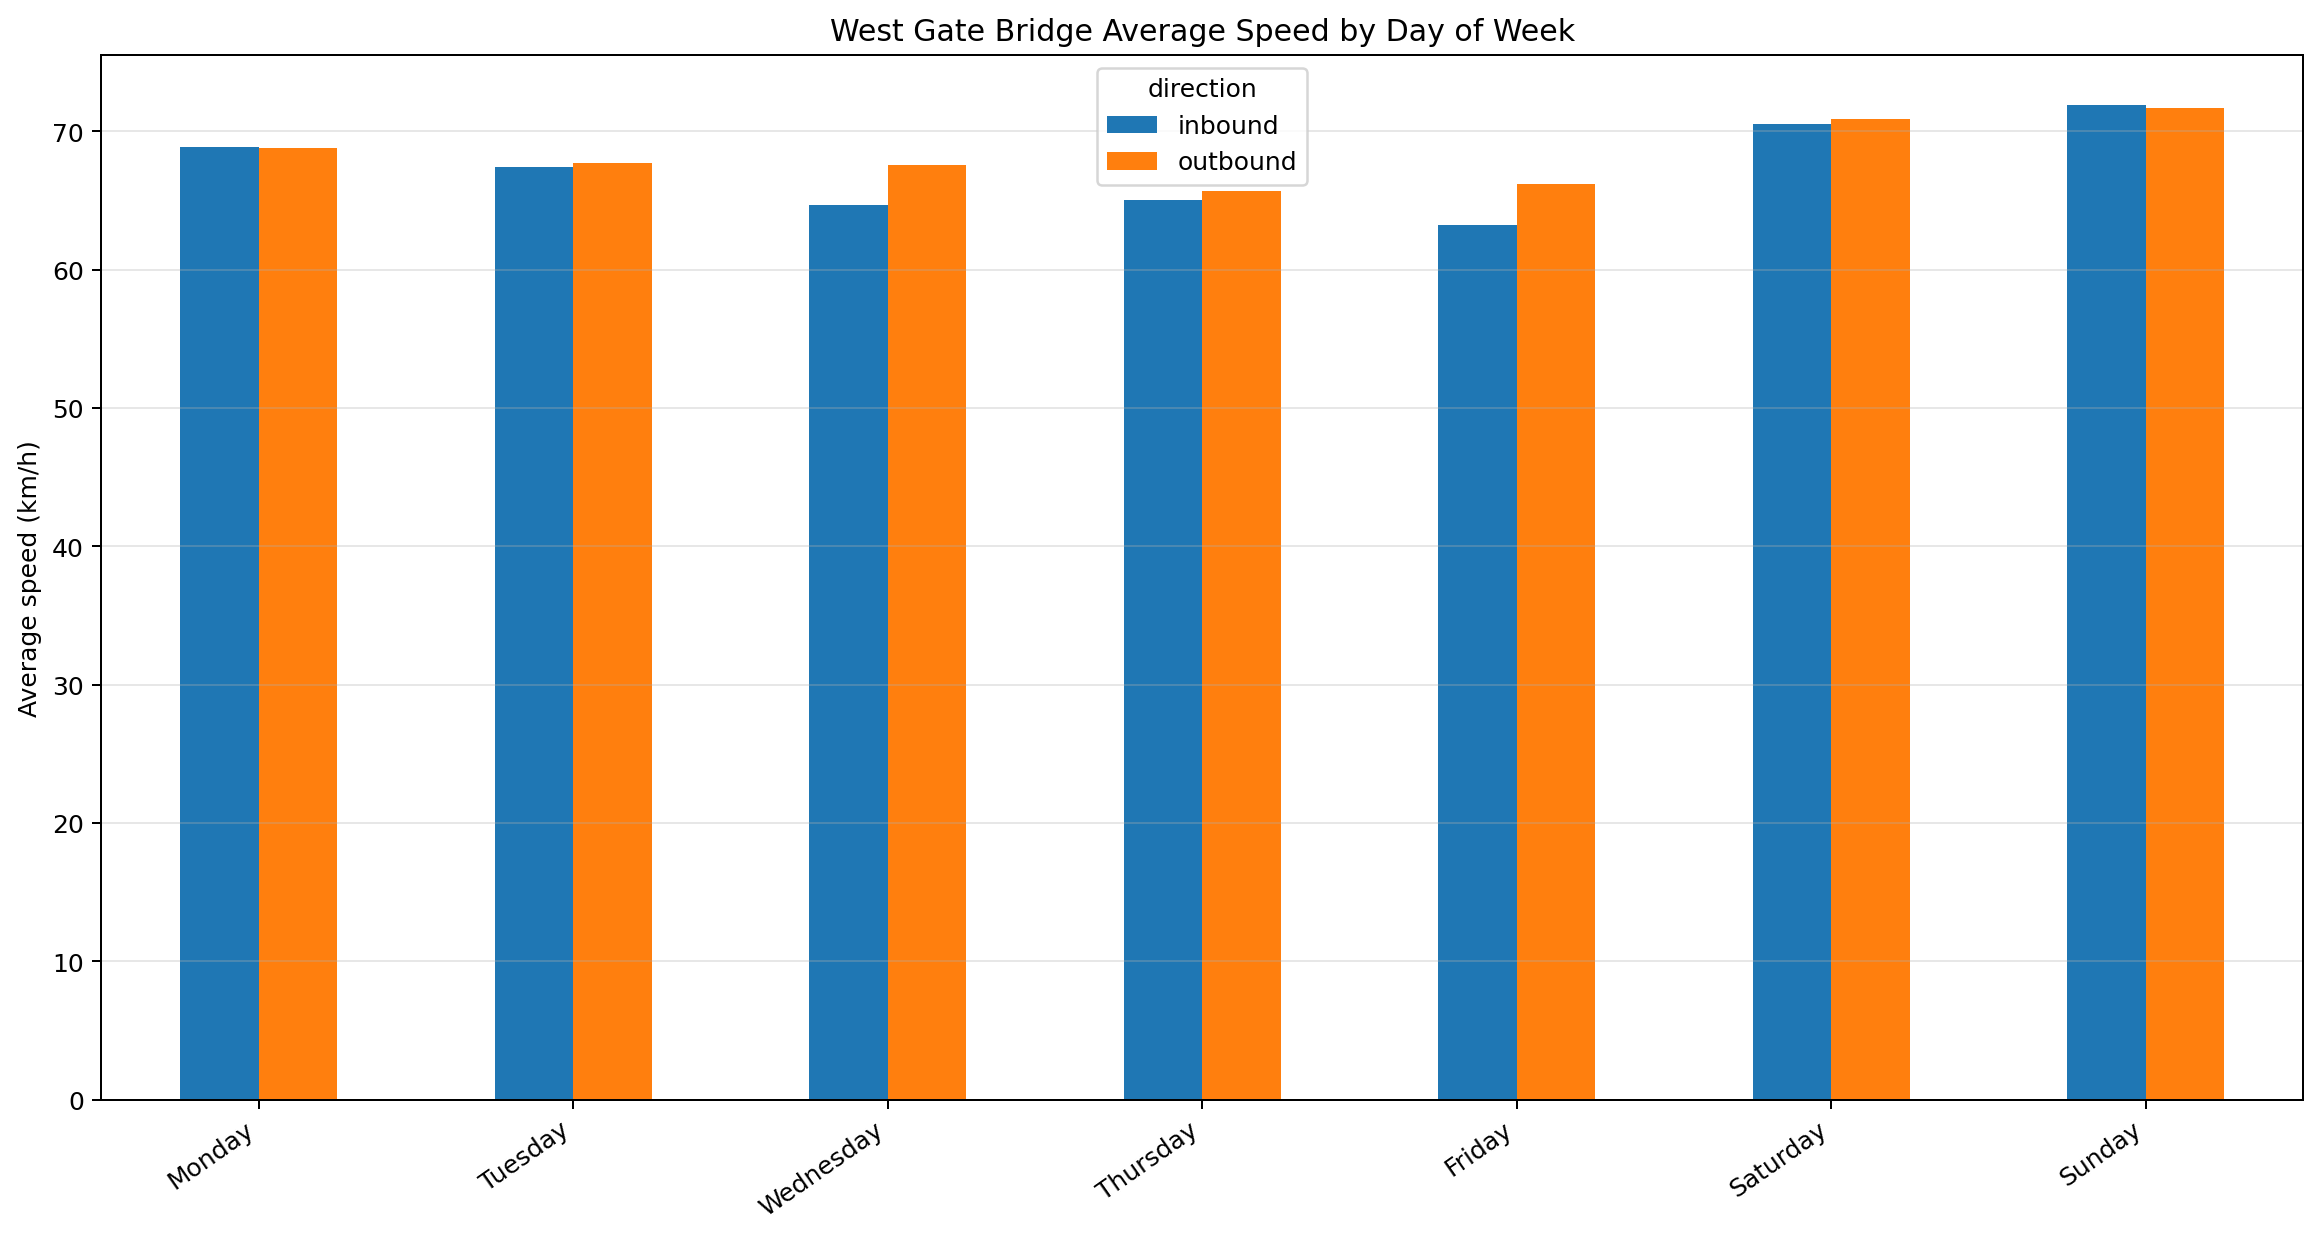
Average Speed by Day of Week
Complements the flow chart above by showing that weekends are not just lighter — they are
generally faster and more reliable as well.
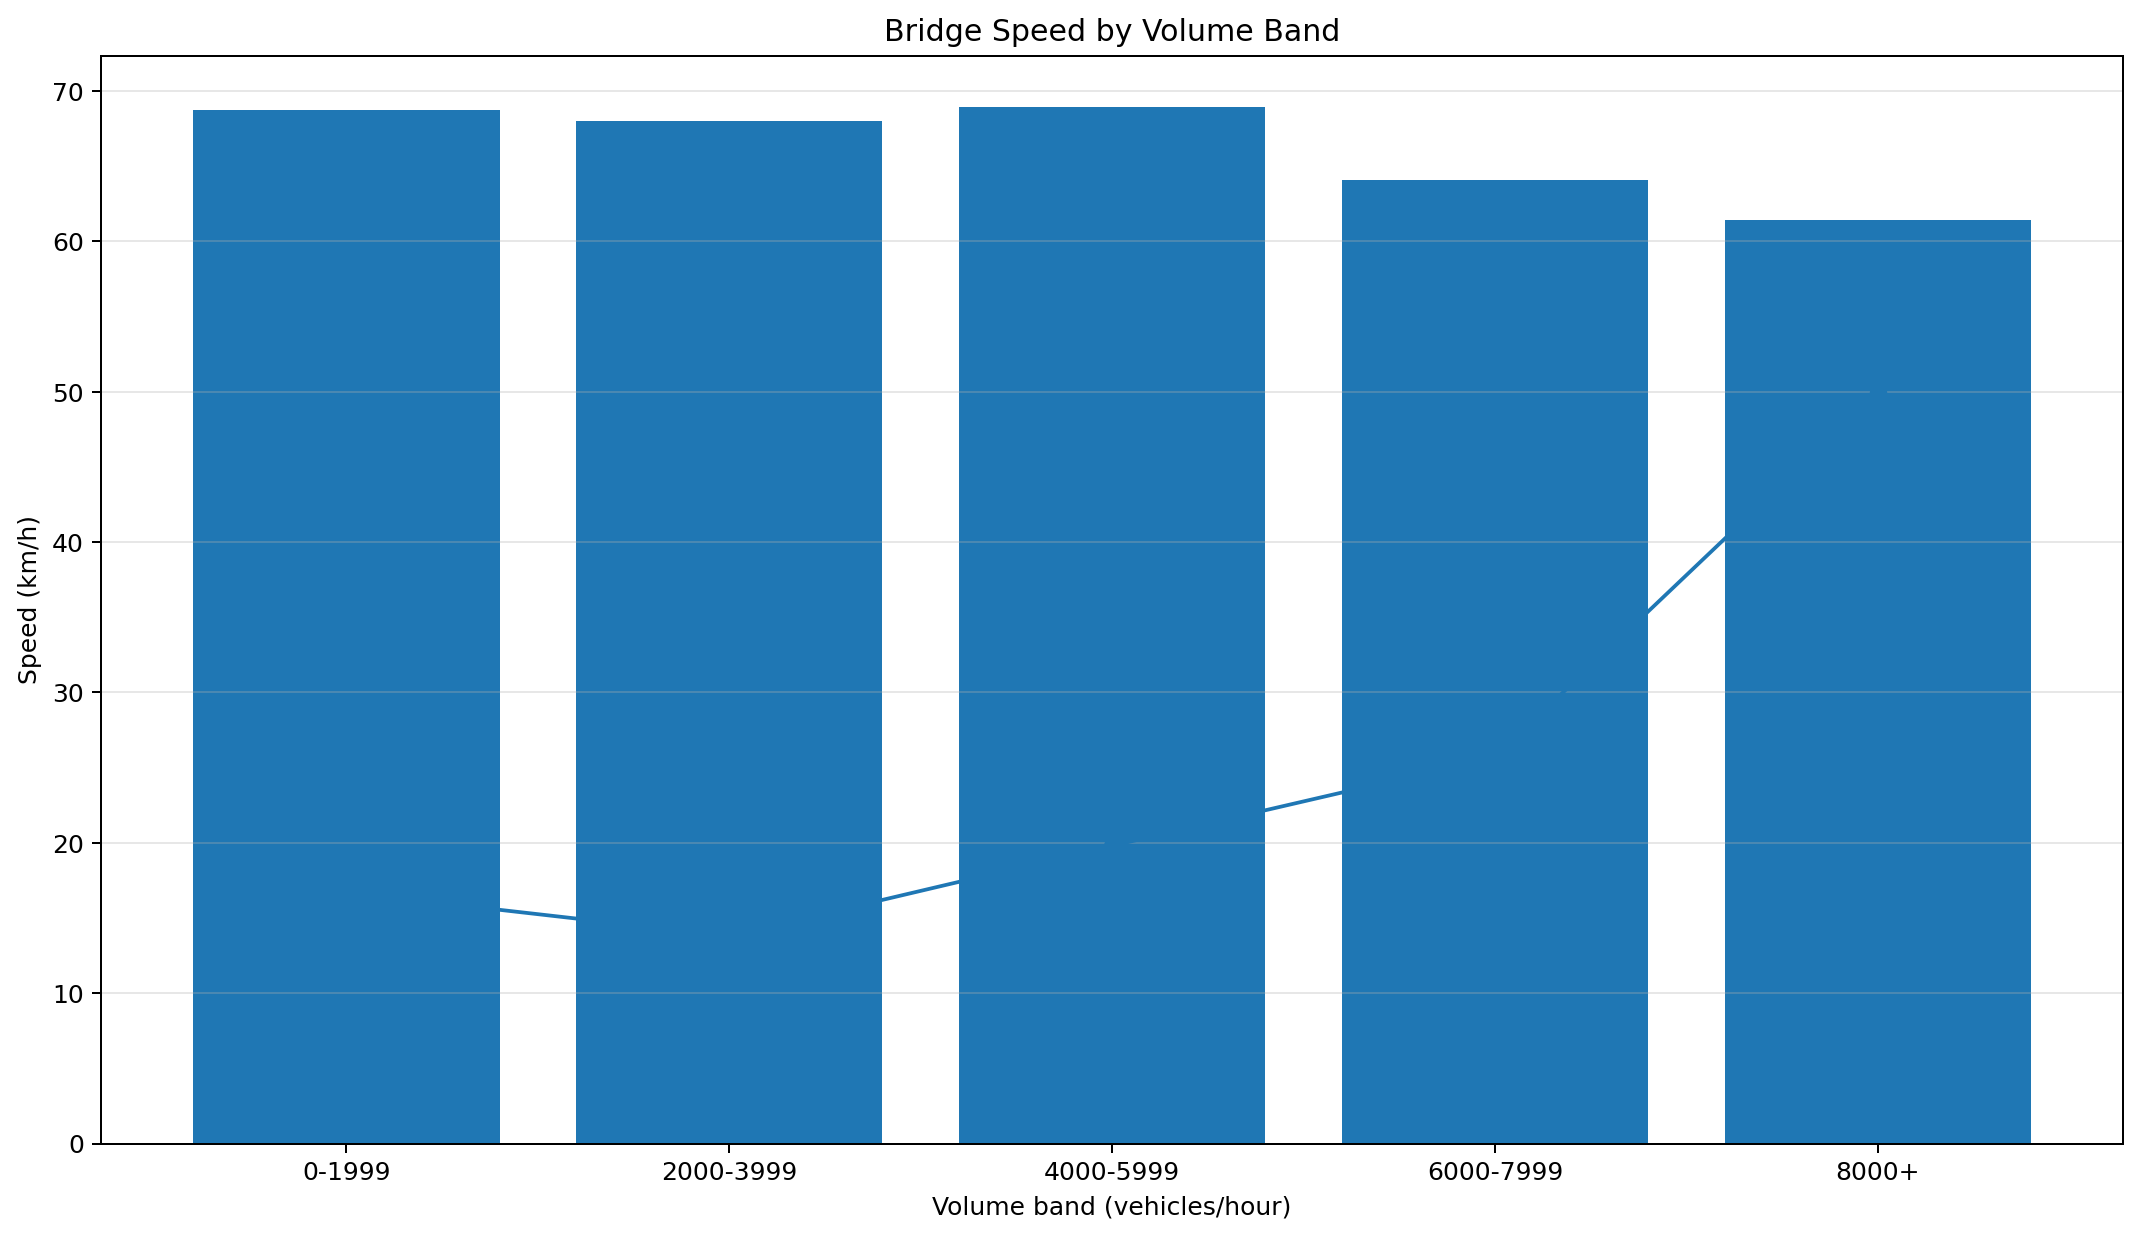
Speed by Volume Band
This chart shows how bridge performance changes as demand rises. At higher flow bands,
average speeds fall and the corridor becomes less forgiving under stress.
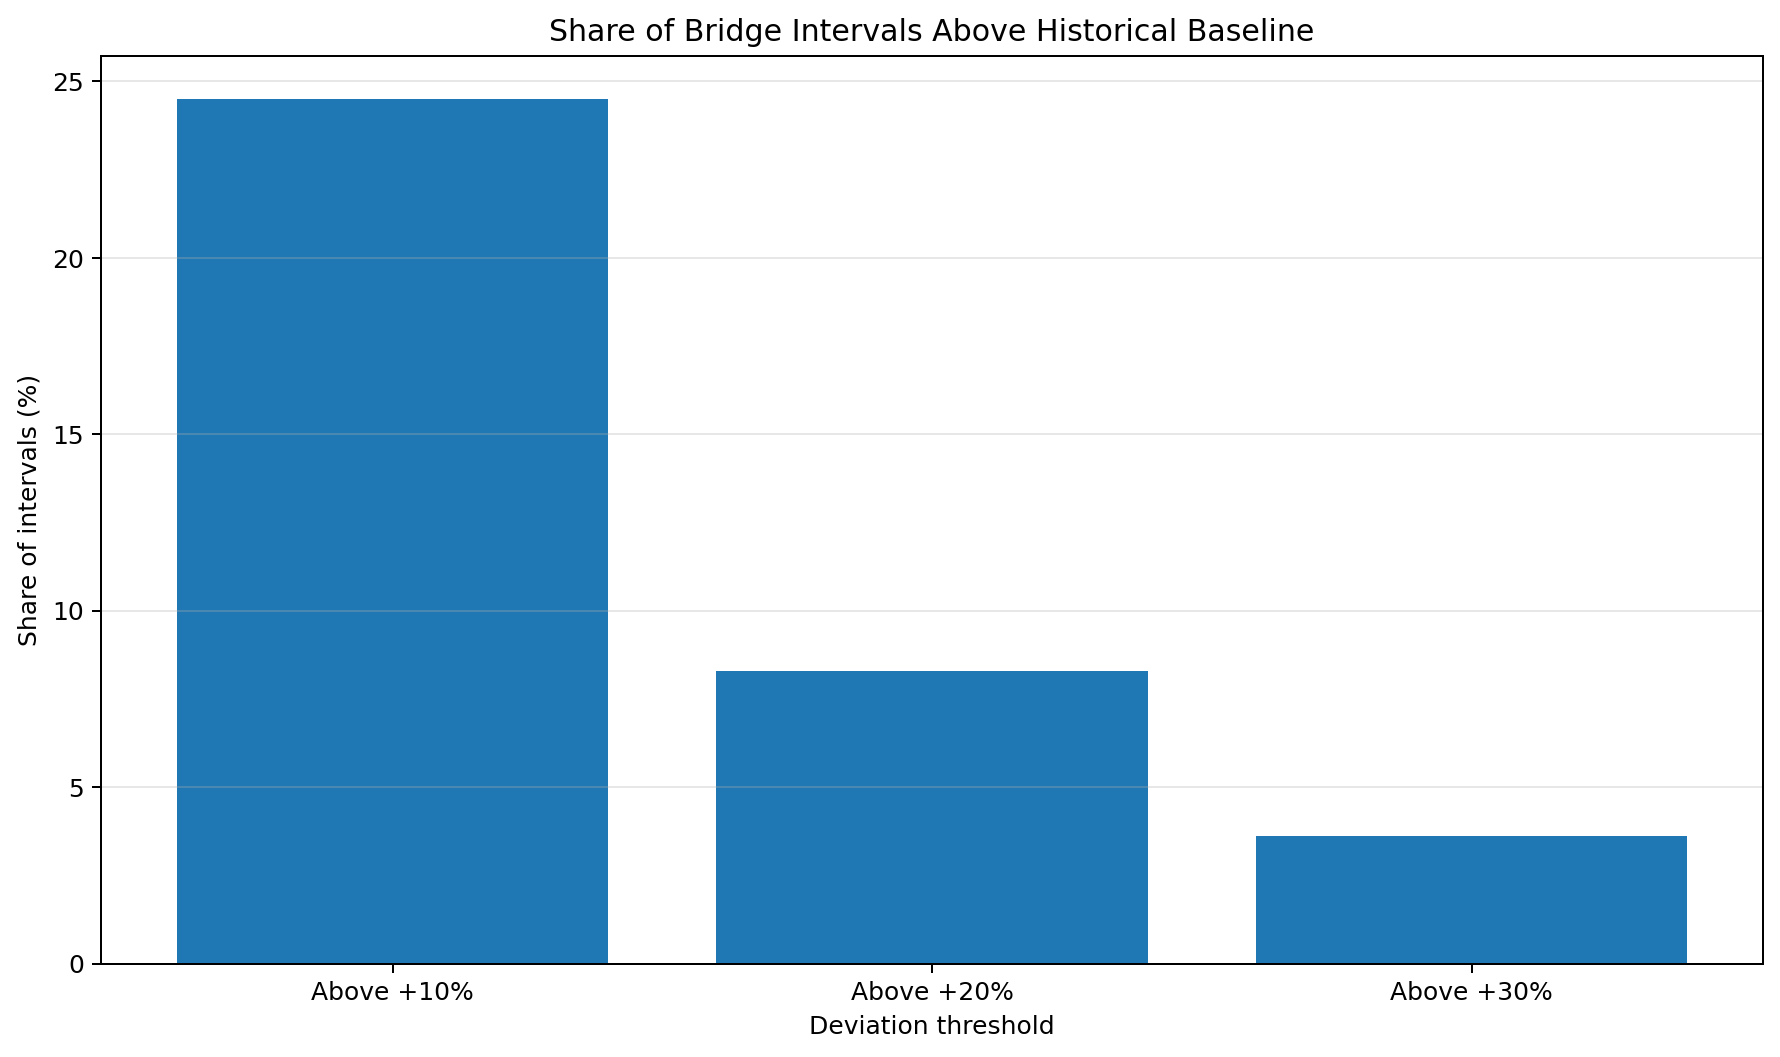
Share of Intervals Above Historical Baseline
A compact summary of anomaly frequency. It shows that unusually heavy traffic is not rare:
24.5% of intervals sit more than 10% above their expected baseline.
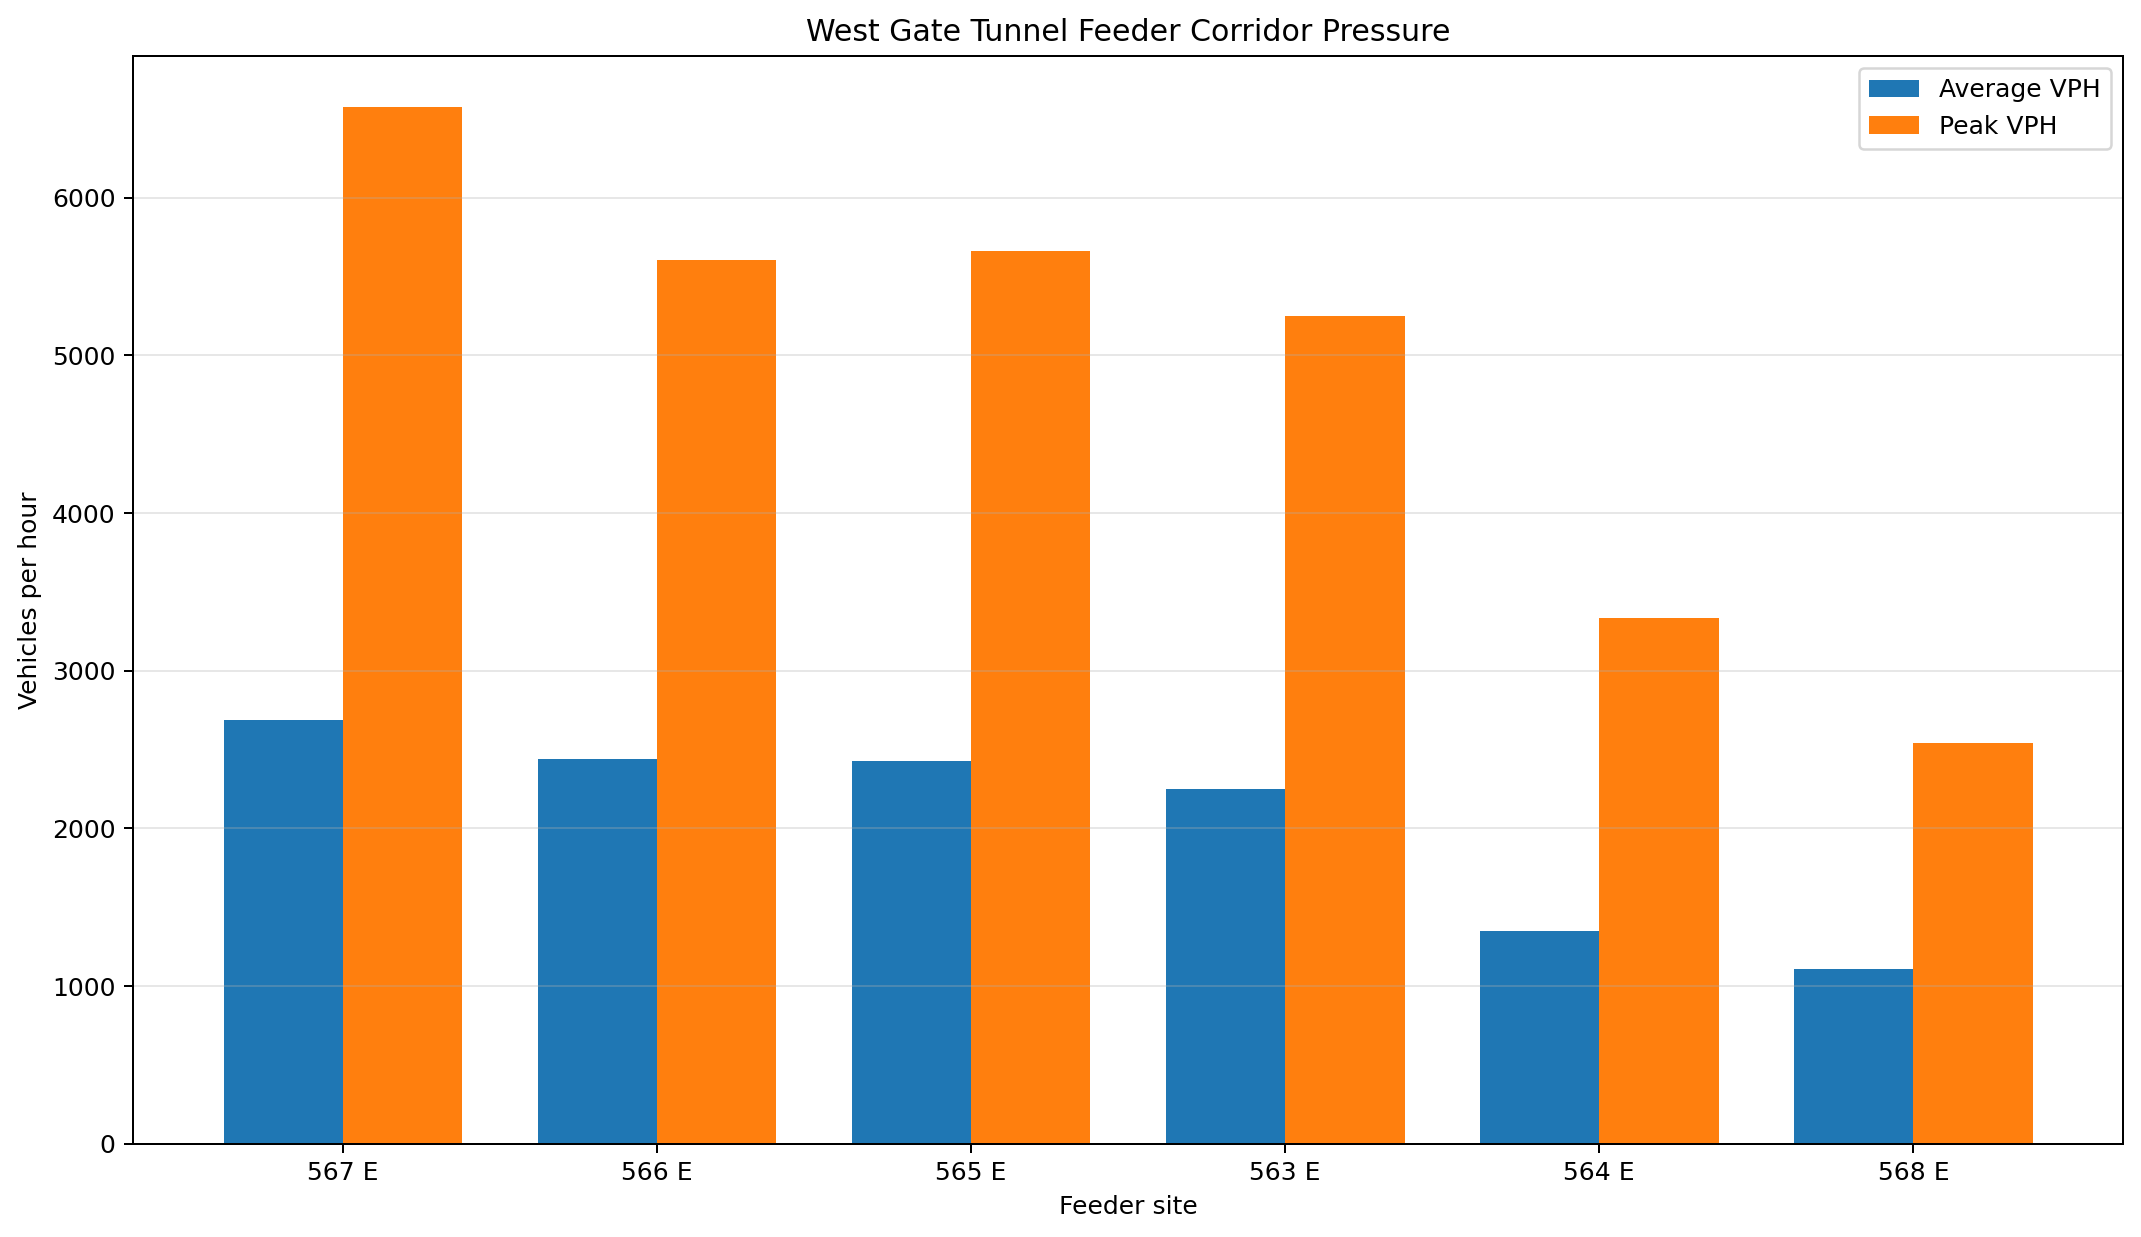
Feeder Corridor Average vs Peak Pressure
Shows the strength of the eastbound feeder system feeding the bridge and tunnel approaches.
It reinforces that congestion is generated by the wider network, not one isolated point.
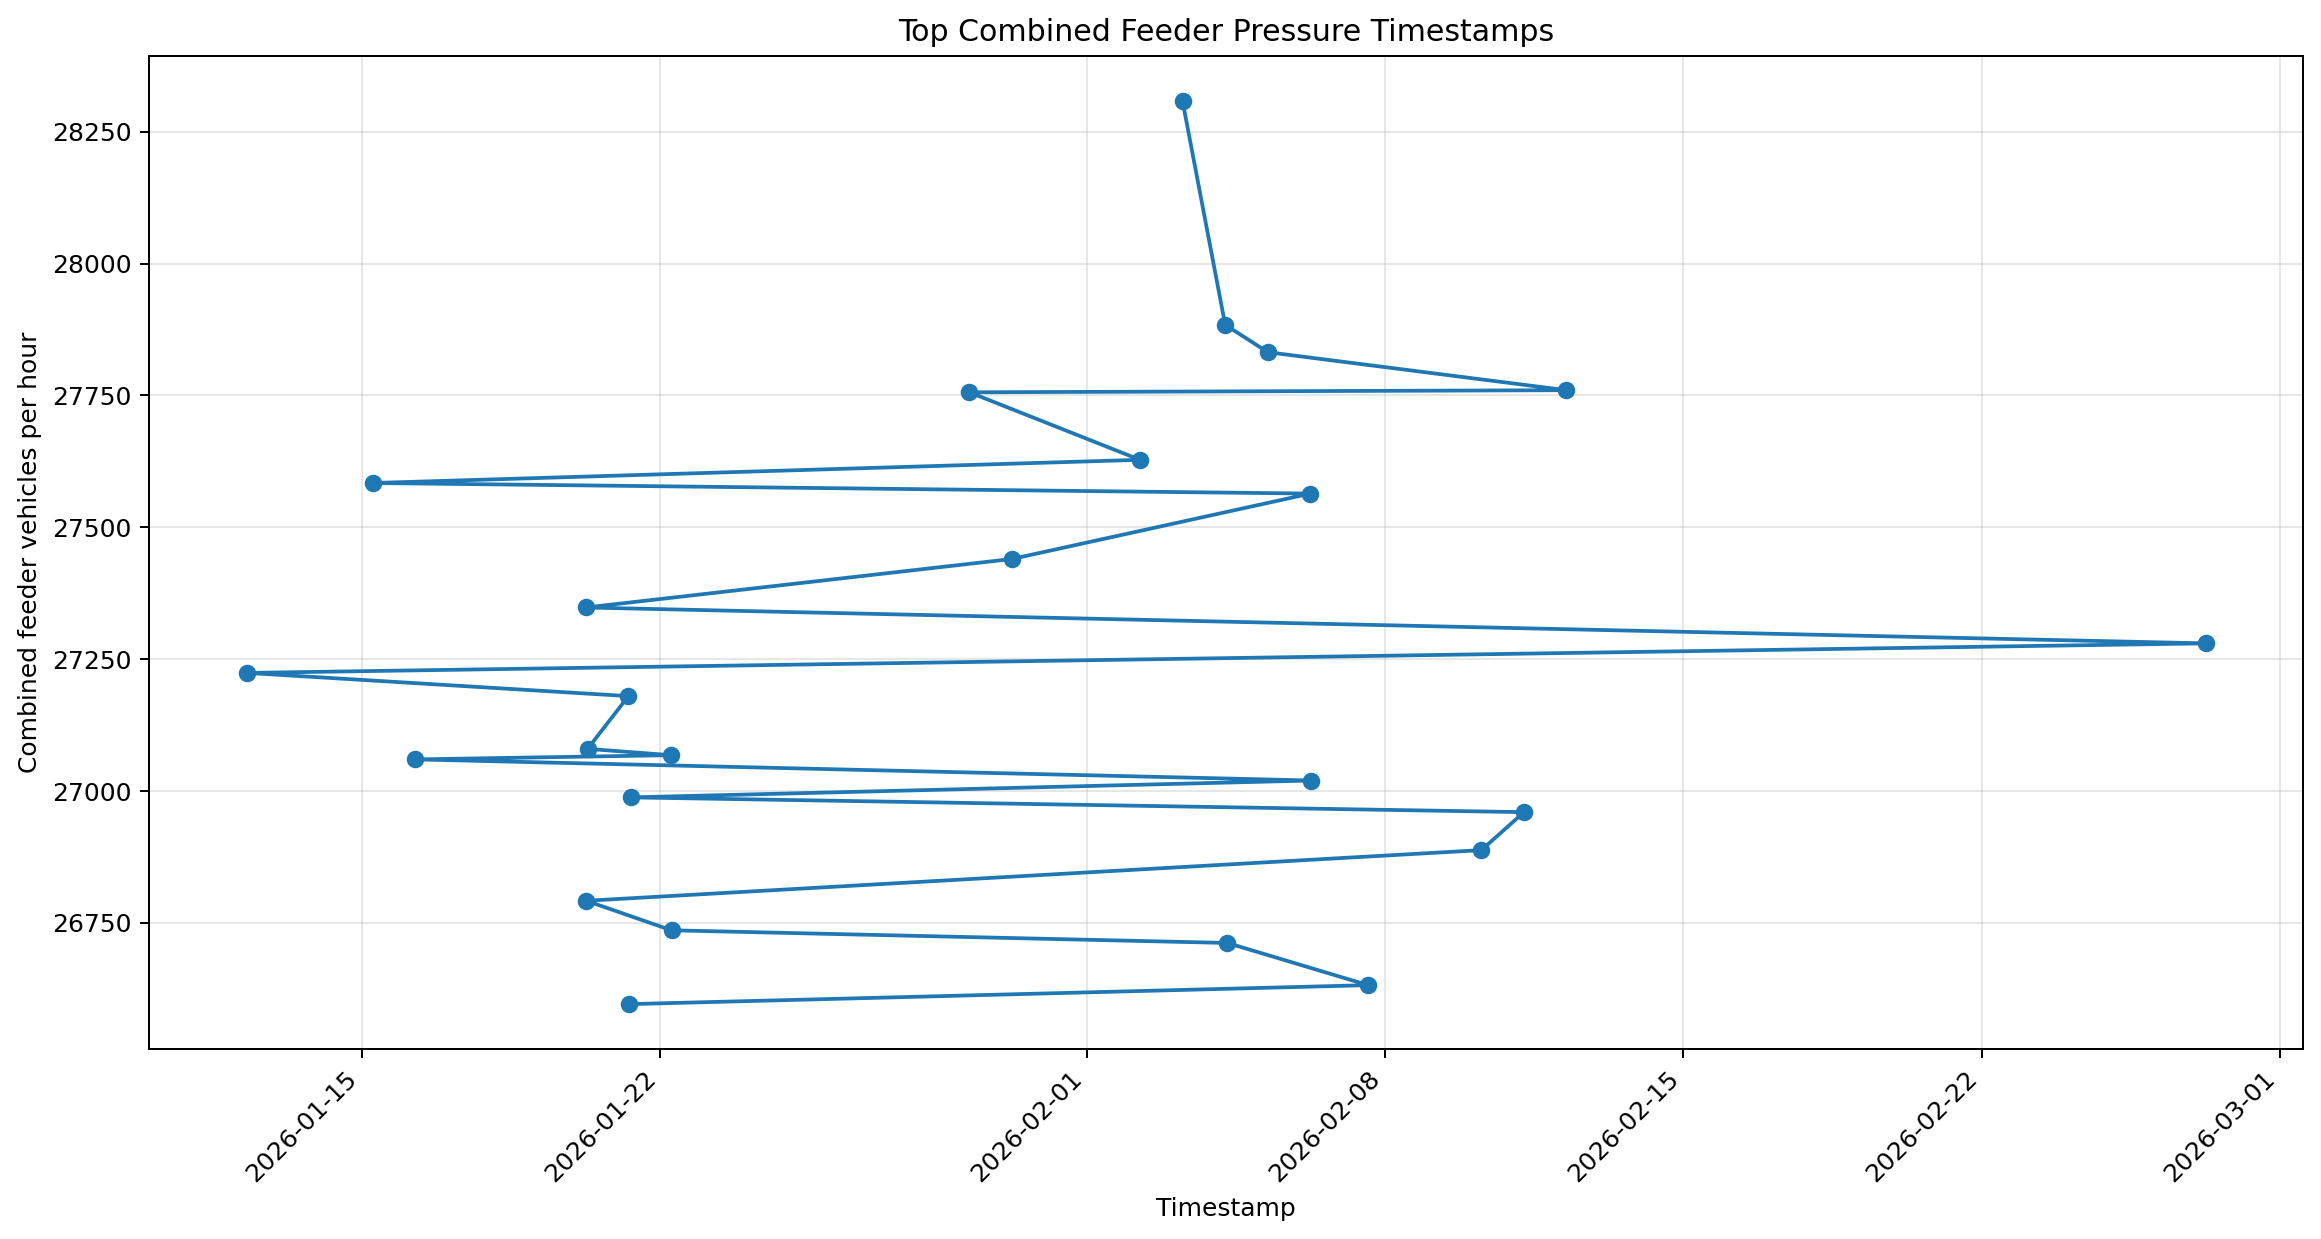
Top Combined Feeder Pressure Timestamps
Highlights the most intense feeder-corridor loading periods captured in the analysis.
These timestamps help explain how extreme approach pressure can build around the bridge.
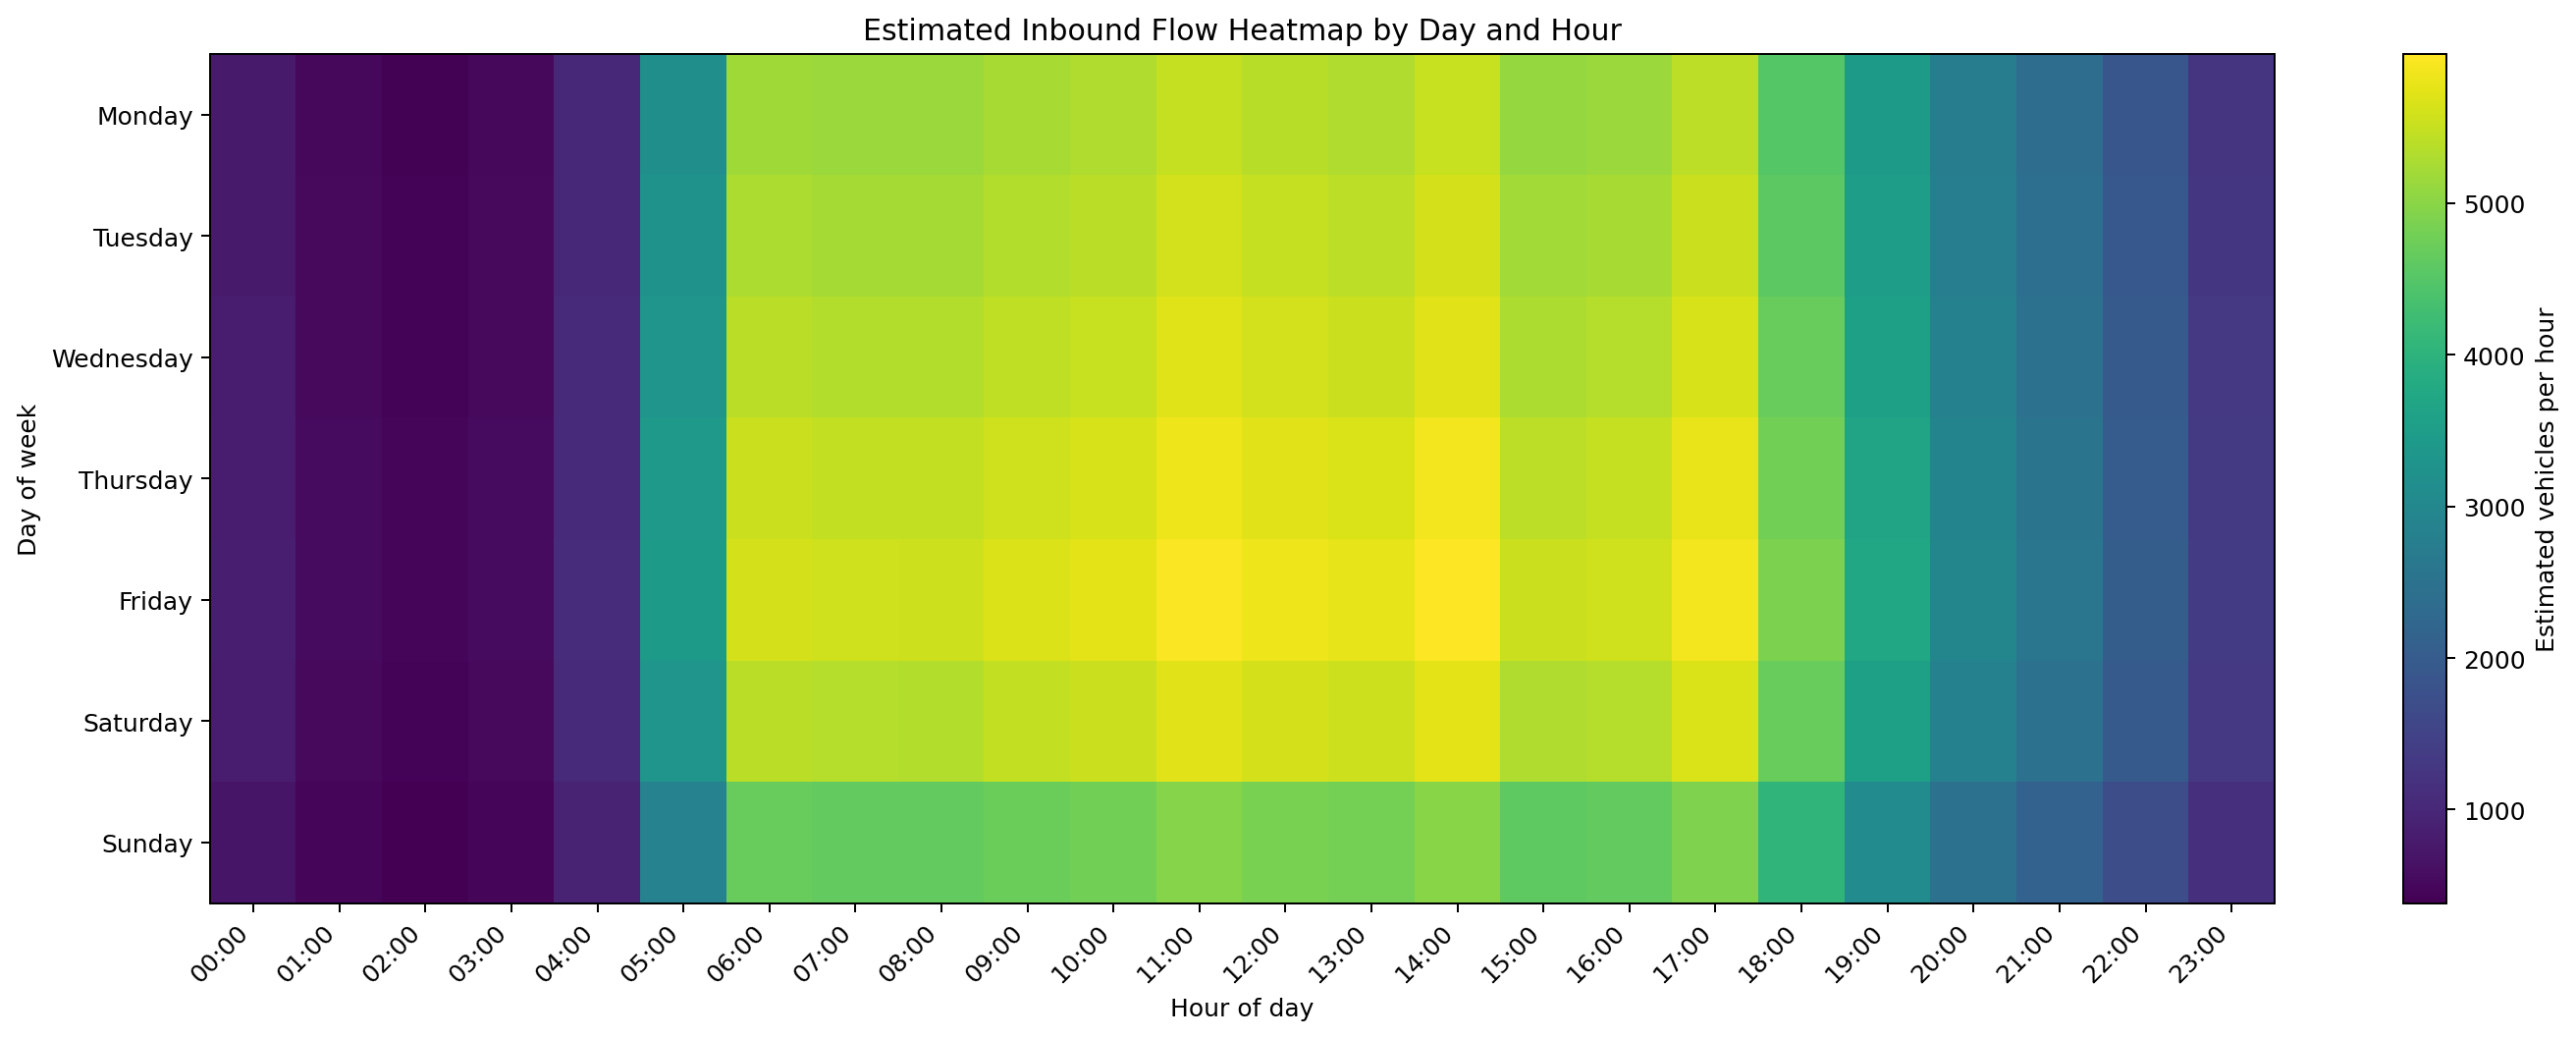
Estimated Inbound Flow Heatmap
A visual pattern map of likely inbound bridge demand by day and hour. It is useful for quickly
identifying repeating daily structure and strong morning demand windows.
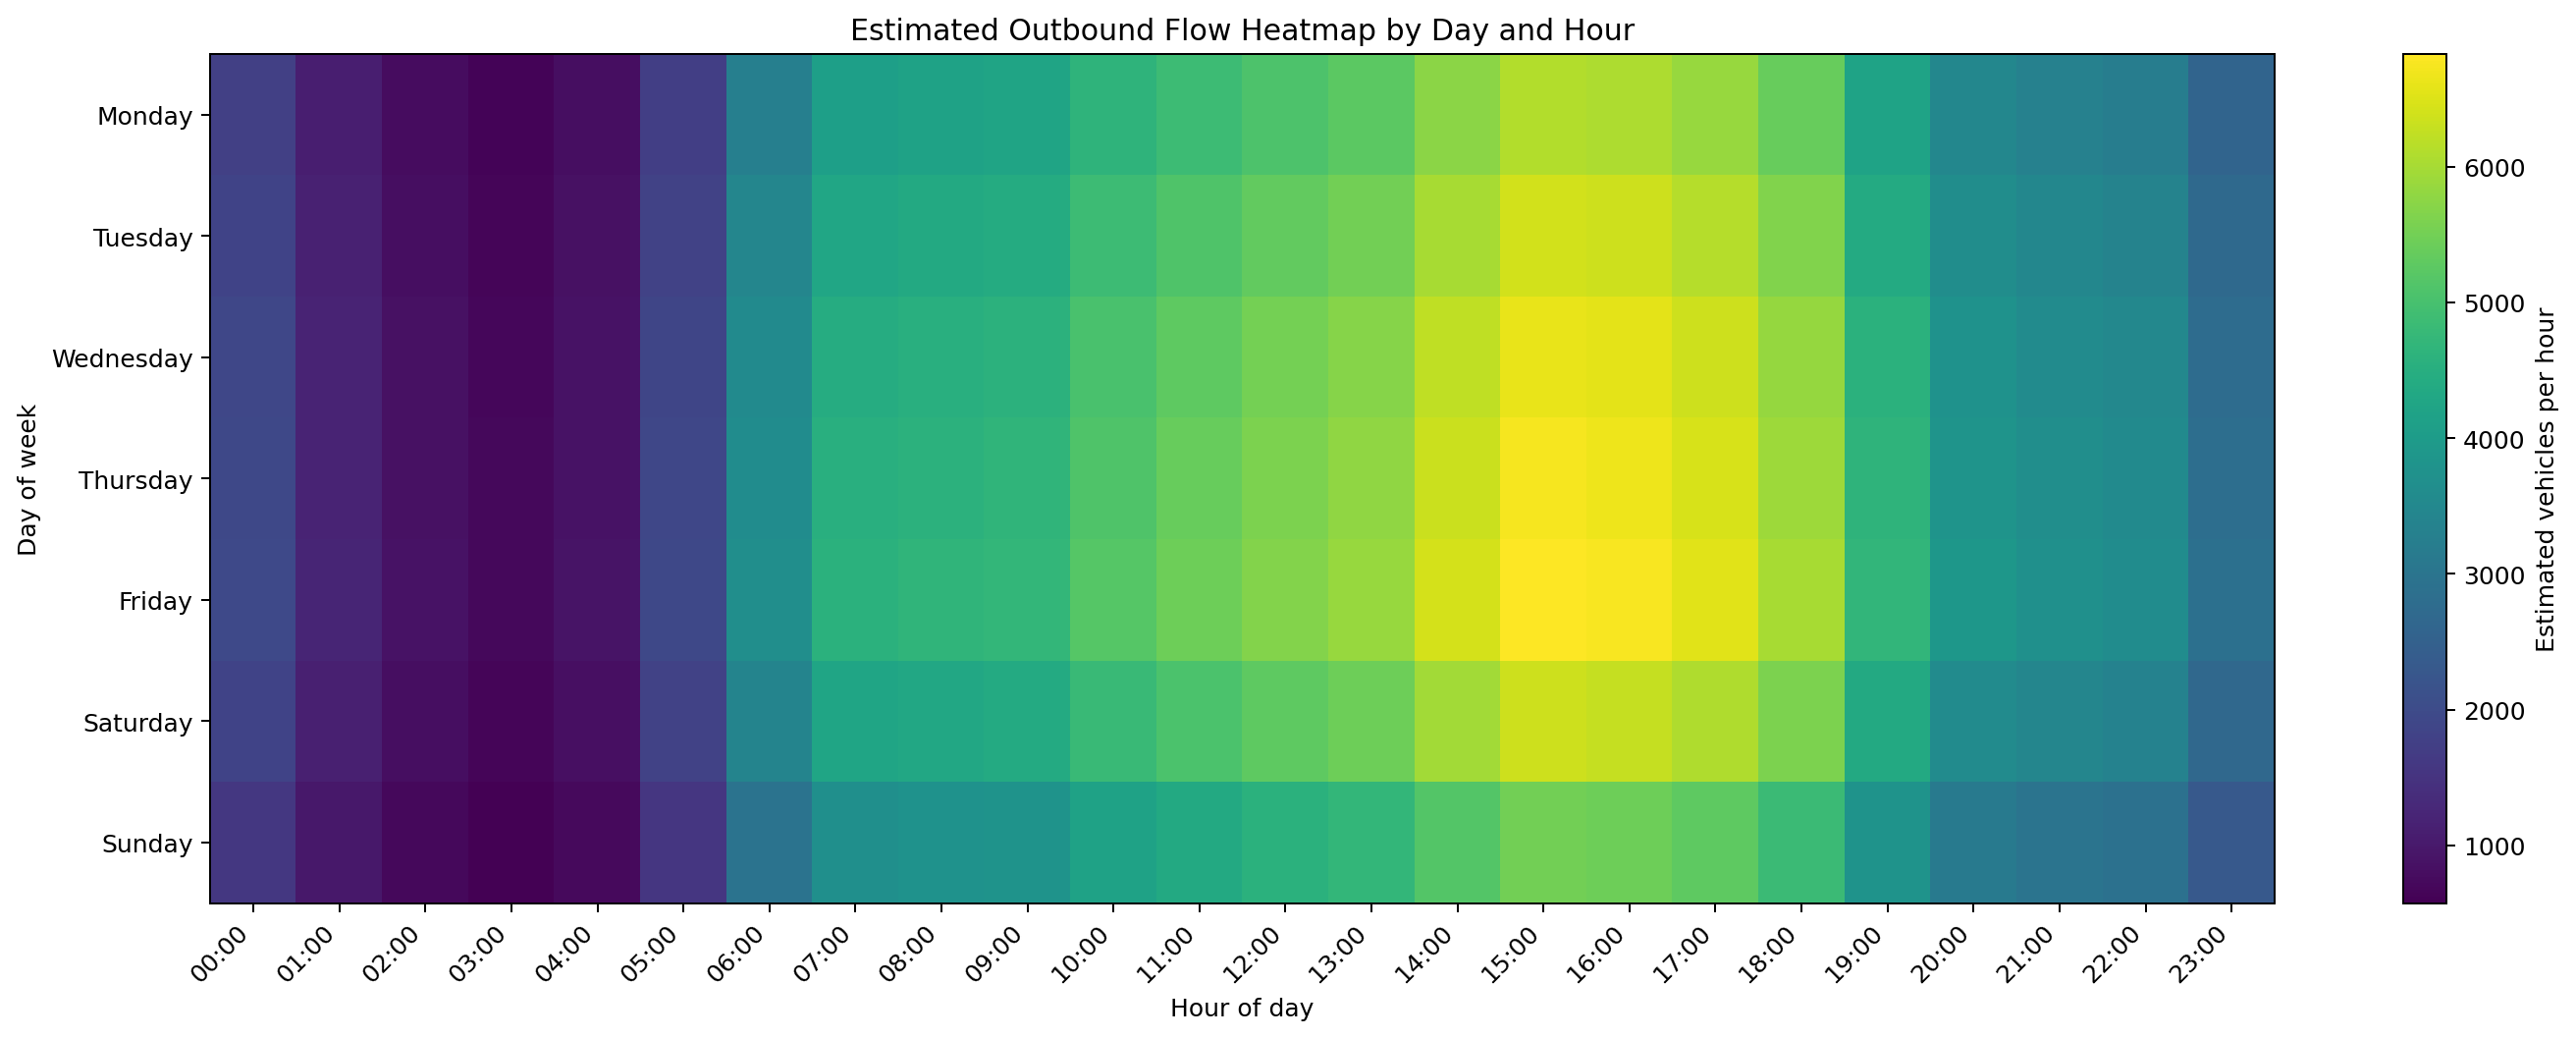
Estimated Outbound Flow Heatmap
A visual pattern map of likely outbound bridge demand by day and hour. It makes the afternoon
and evening outbound wave especially easy to see.
Headline Metrics Chart
A compact visual summary of the page’s key headline figures, including bridge load, peak flow,
average speed and low-speed stress points.
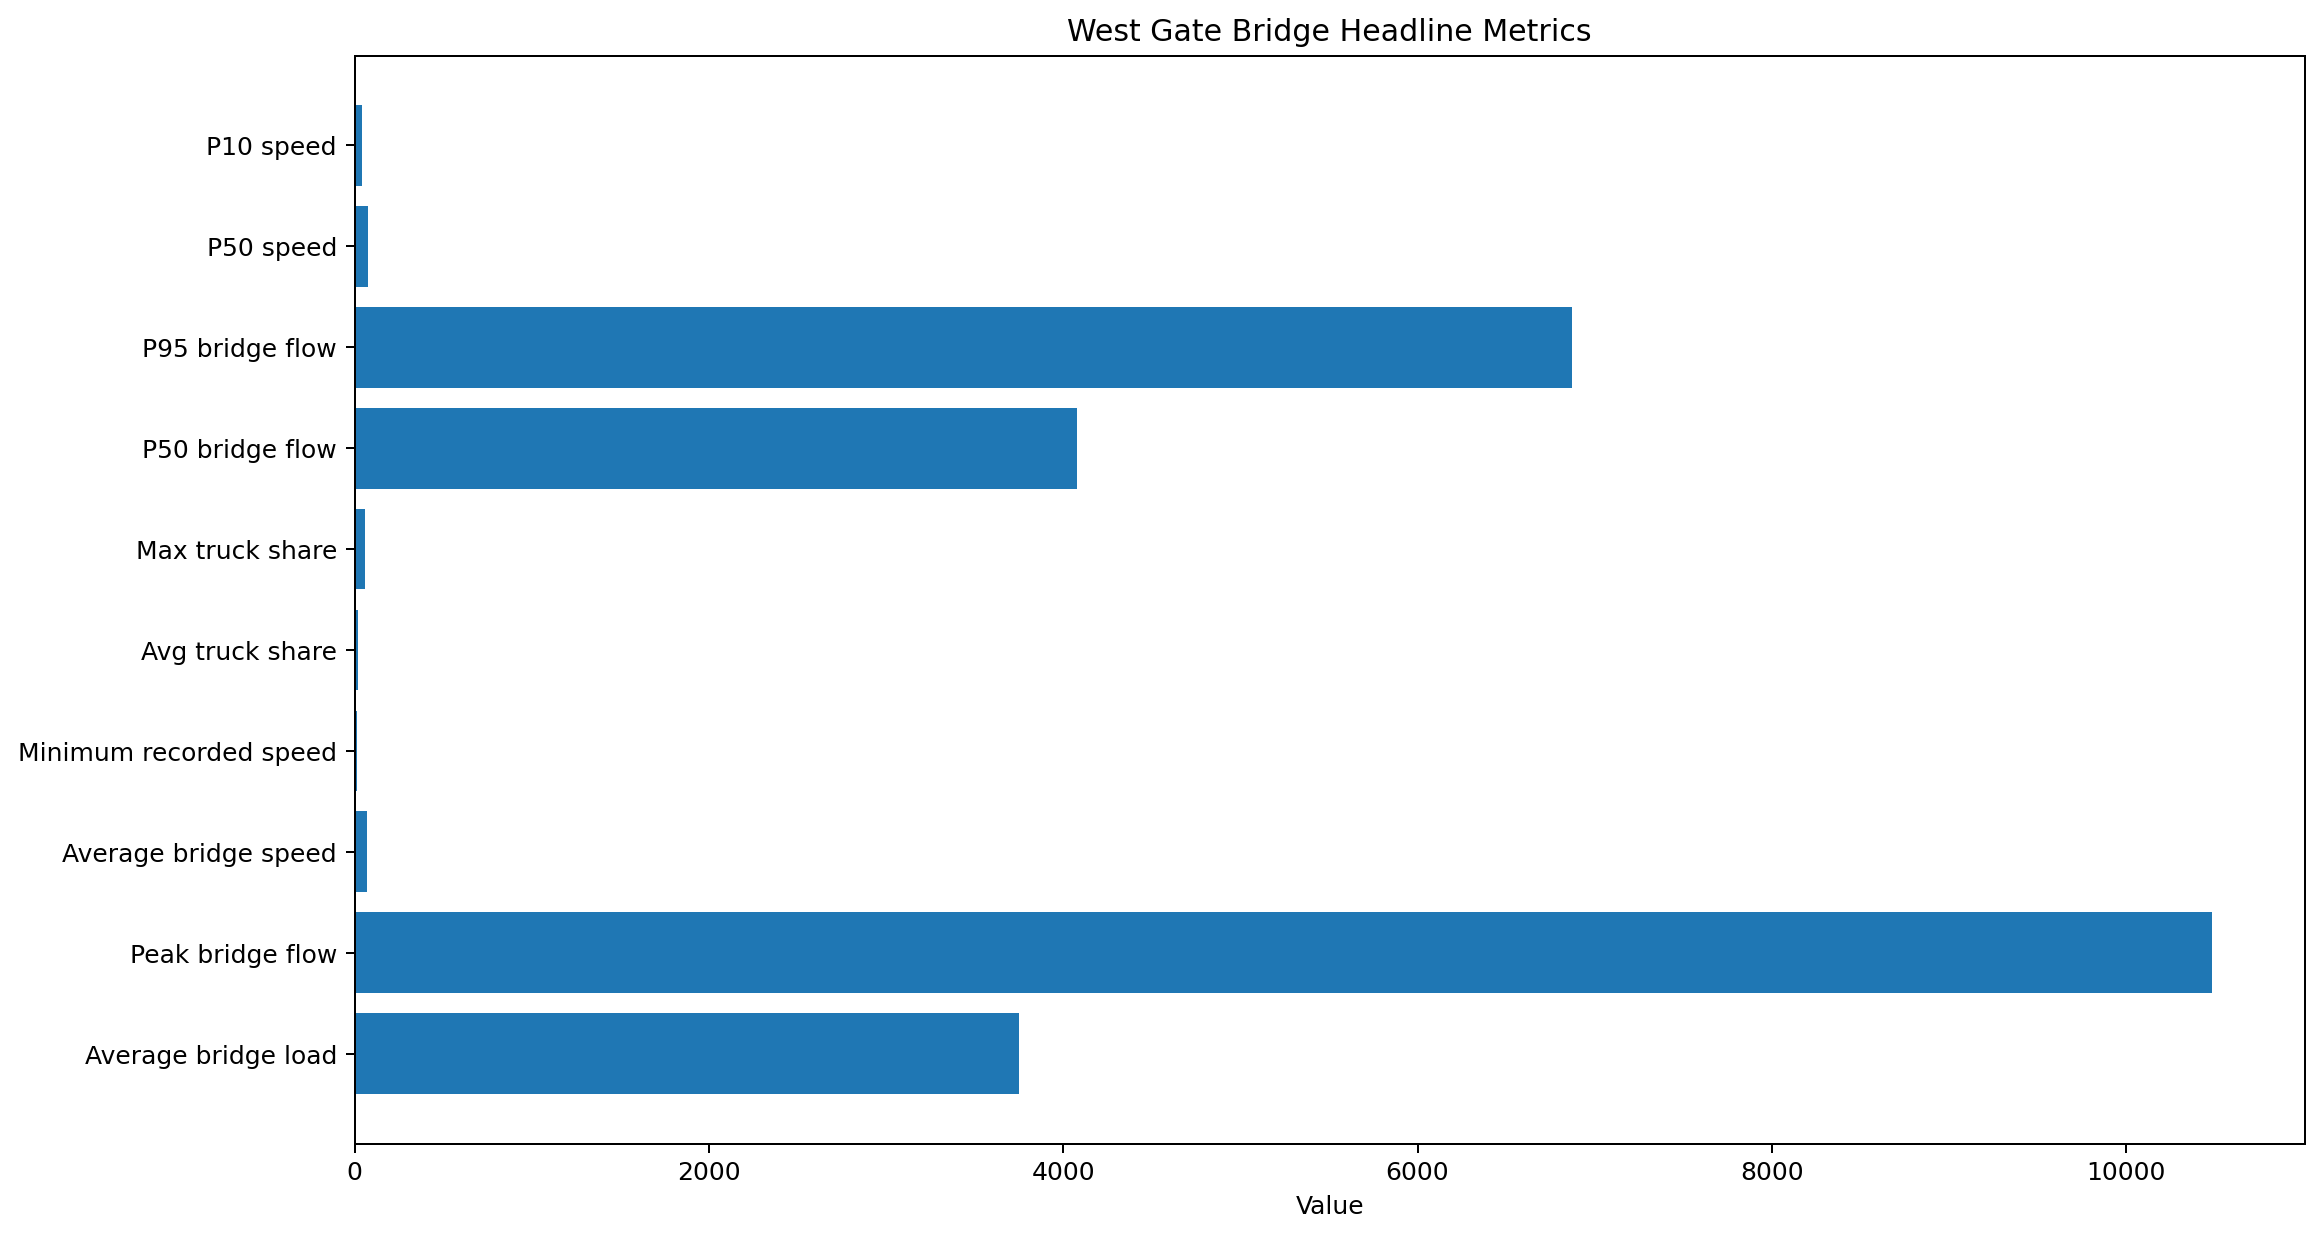
Charts are based on the published statistical summary generated from westgate_tirtl.db.
Heatmaps are estimated visual composites derived from the hourly and day-of-week averages rather than
a full hour-by-day matrix extracted directly from the raw database.
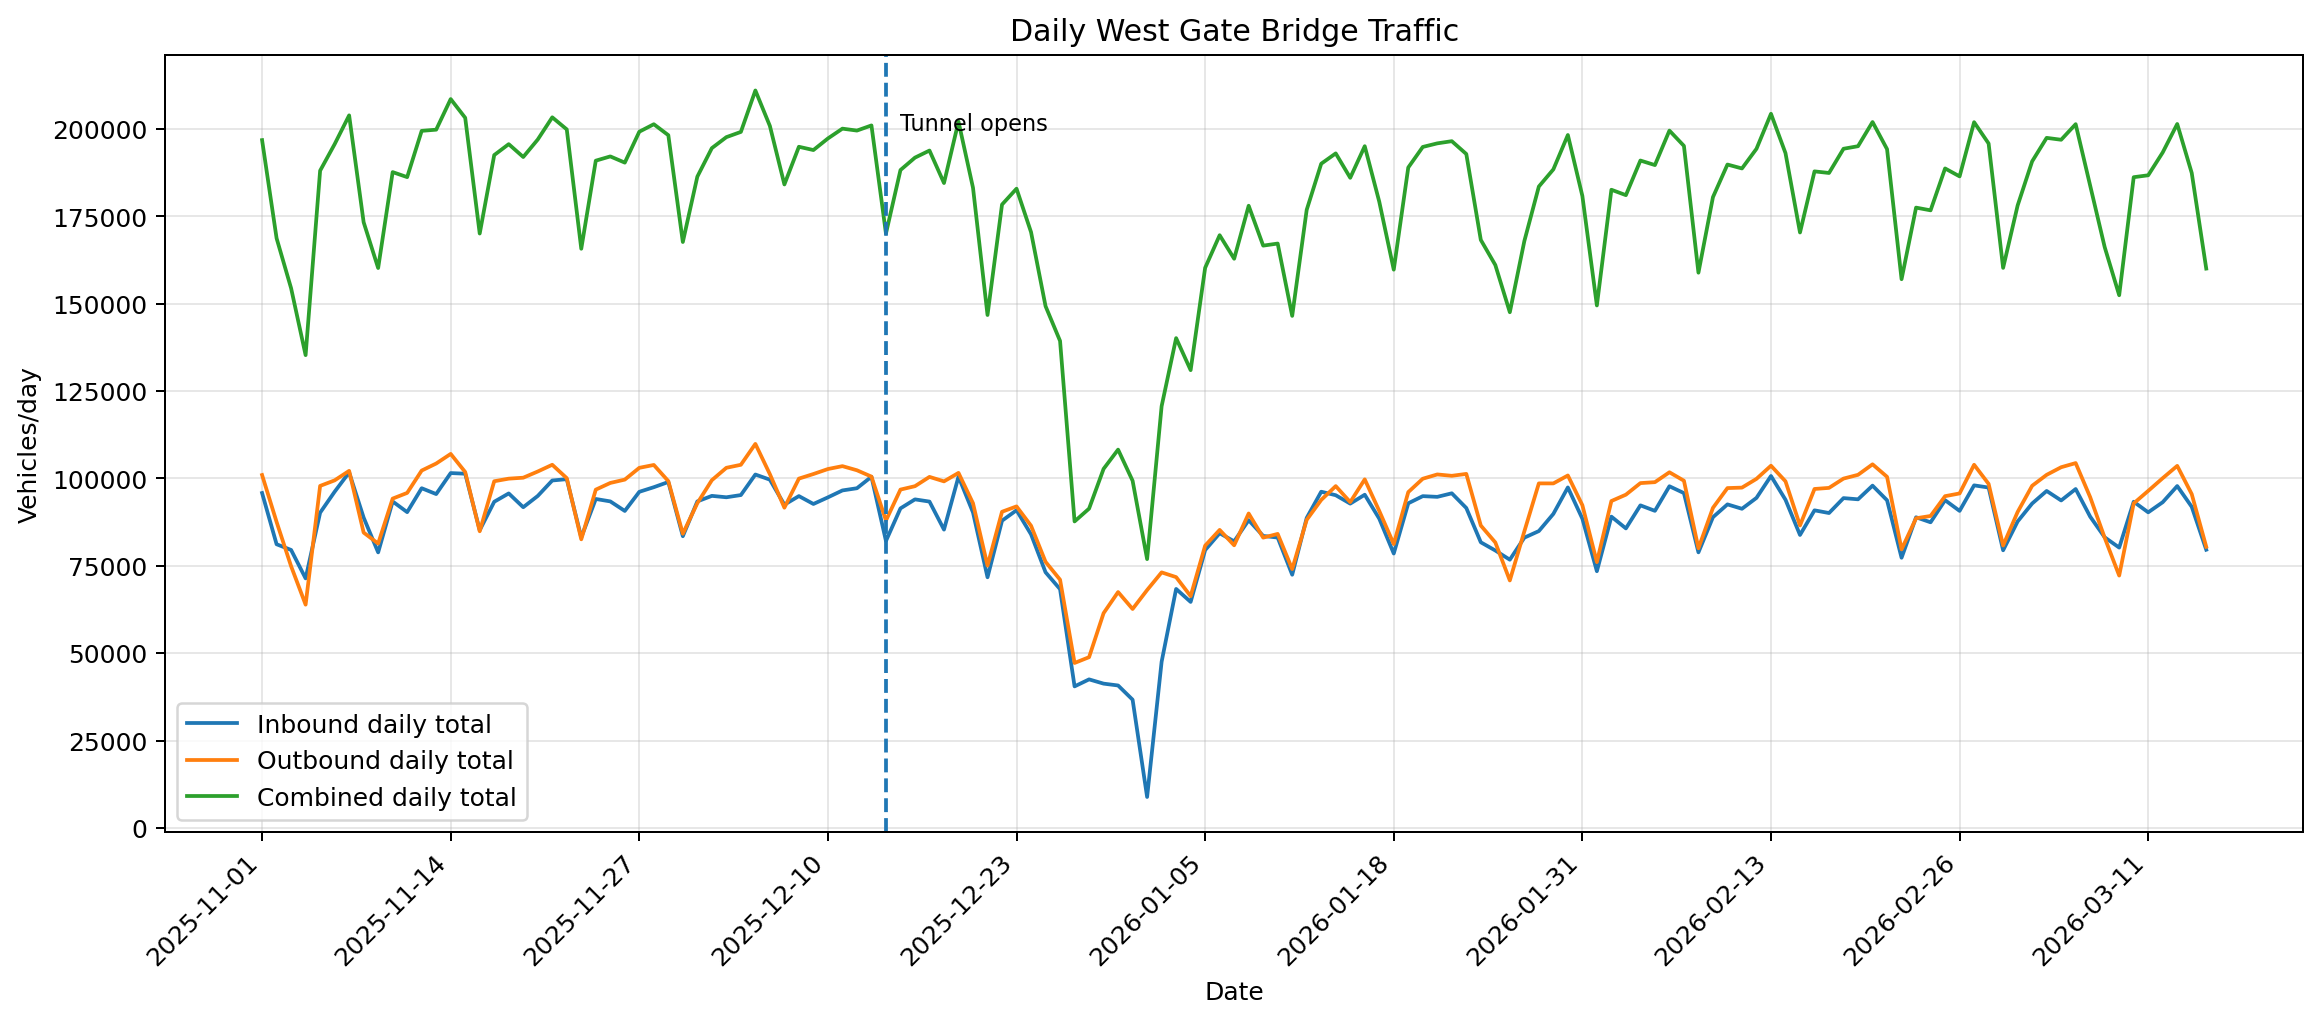
1. West Gate Tunnel / Bridge early comparison
Bridge-wide before/after comparison using the opening split of 2025-12-14.
Bridge comparison statement:
Average weekday bridge traffic changed from 192,875.2 vehicles/day before opening to 178,502.2 after opening, a difference of 14,373.0 vehicles/day over the available comparison period.
Interpretation: based on the available TIRTL comparison window, the bridge is carrying fewer weekday vehicles after the tunnel opened, but the measured reduction visible in this dataset is materially smaller than the larger public claim of 40,000 fewer vehicles per day.
Daily West Gate Bridge Traffic
Daily bridge totals by direction and combined total.
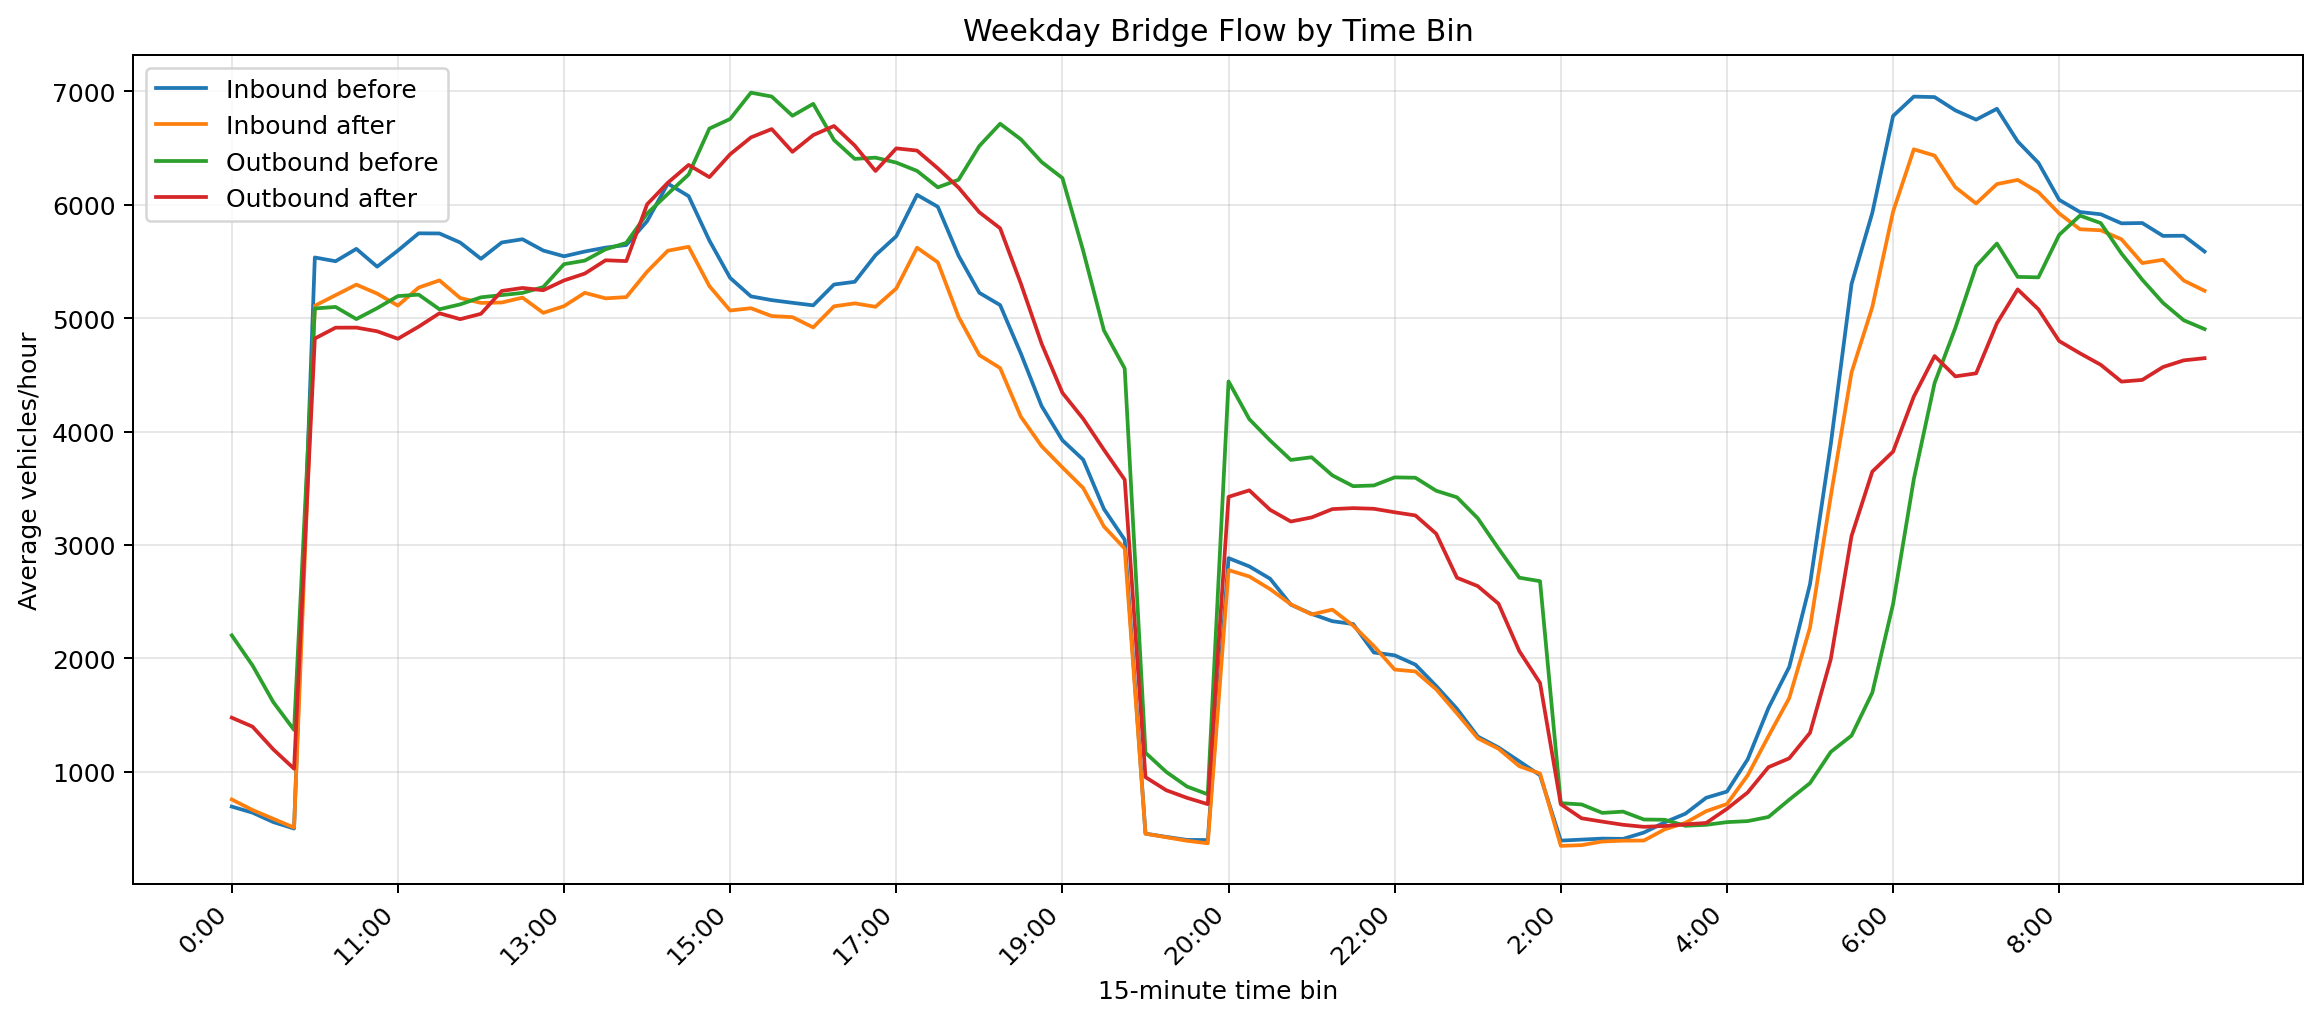
Weekday Bridge Flow by Time Bin
Average weekday bridge demand before and after opening.
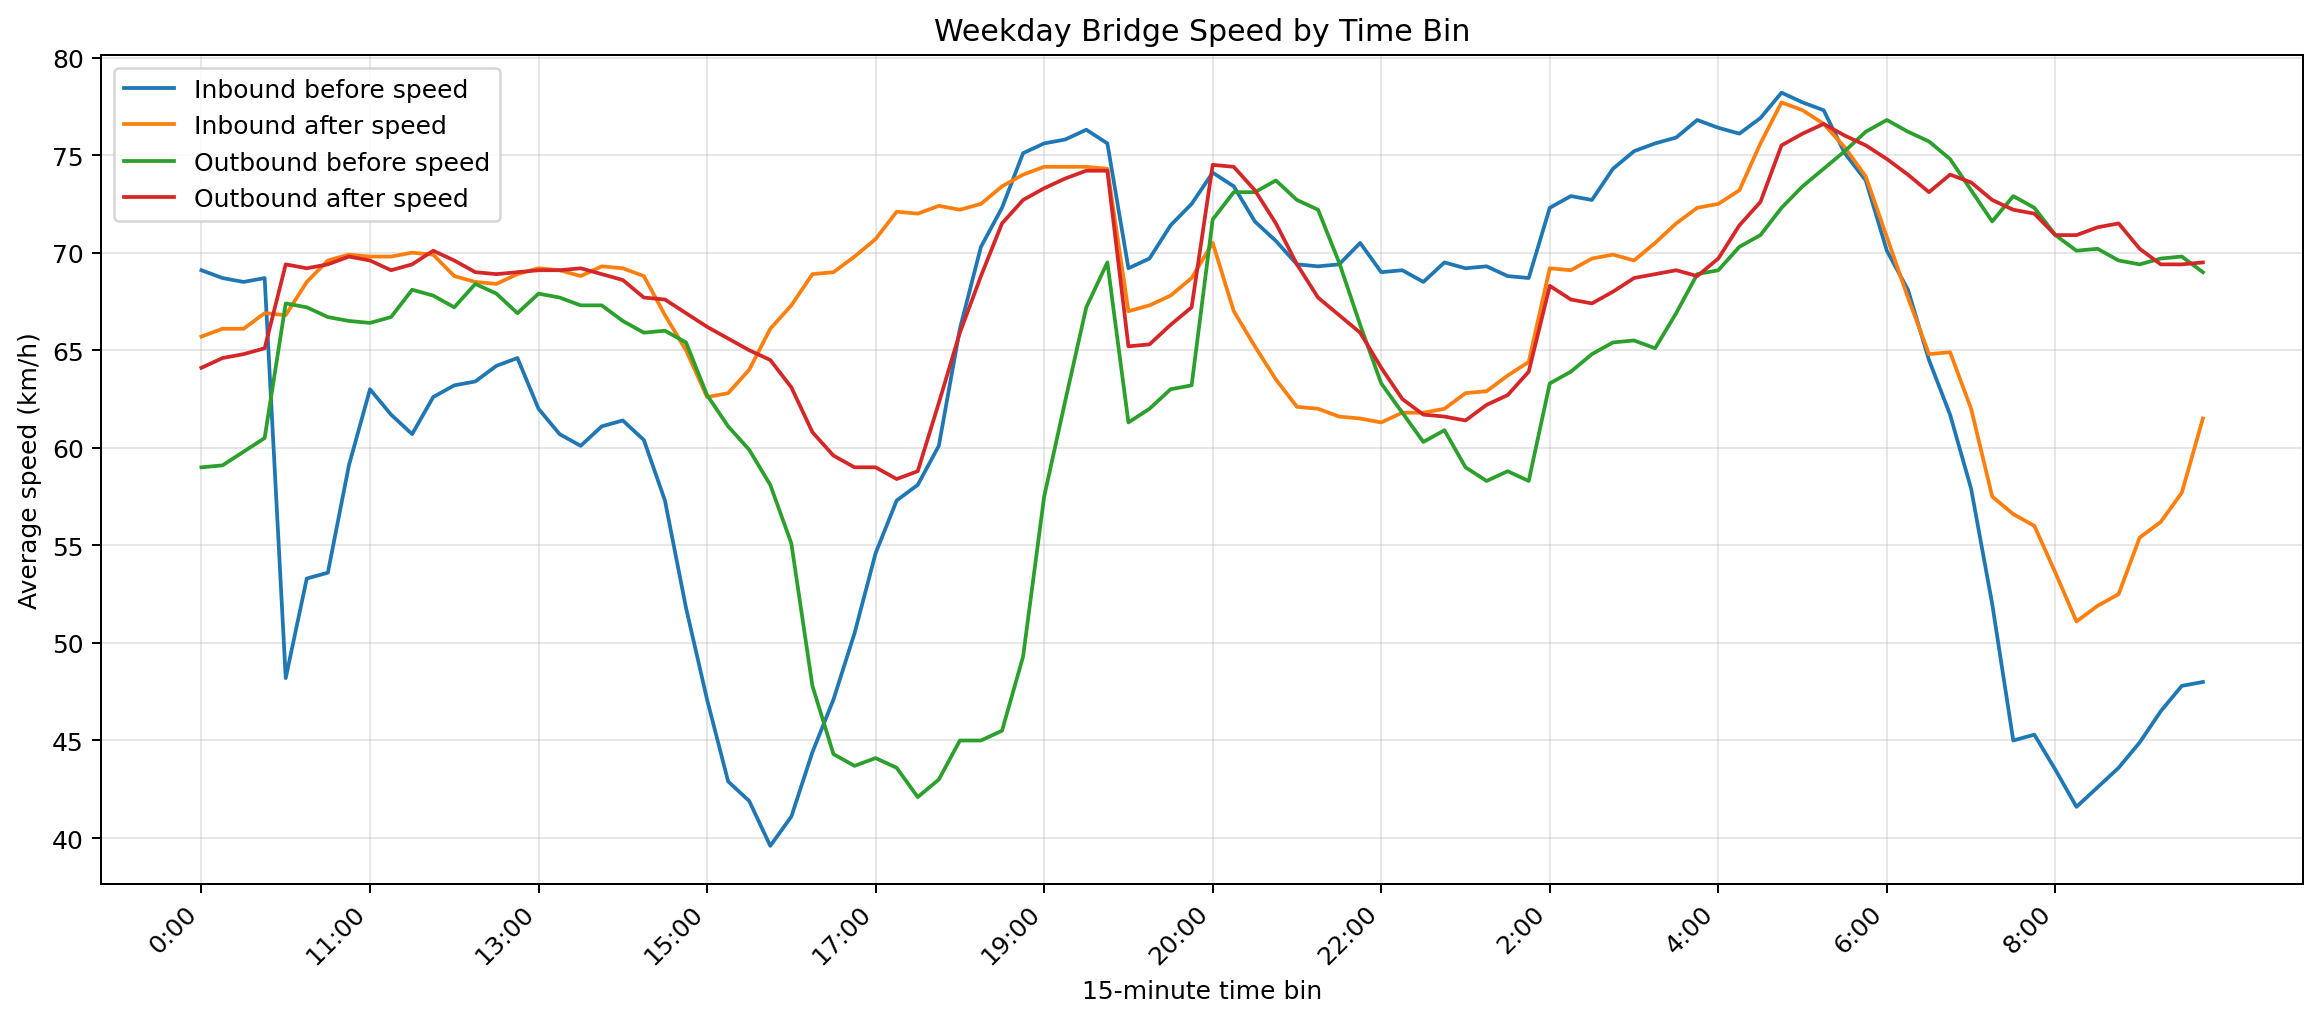
Weekday Bridge Speed by Time Bin
Average weekday bridge speed before and after opening.
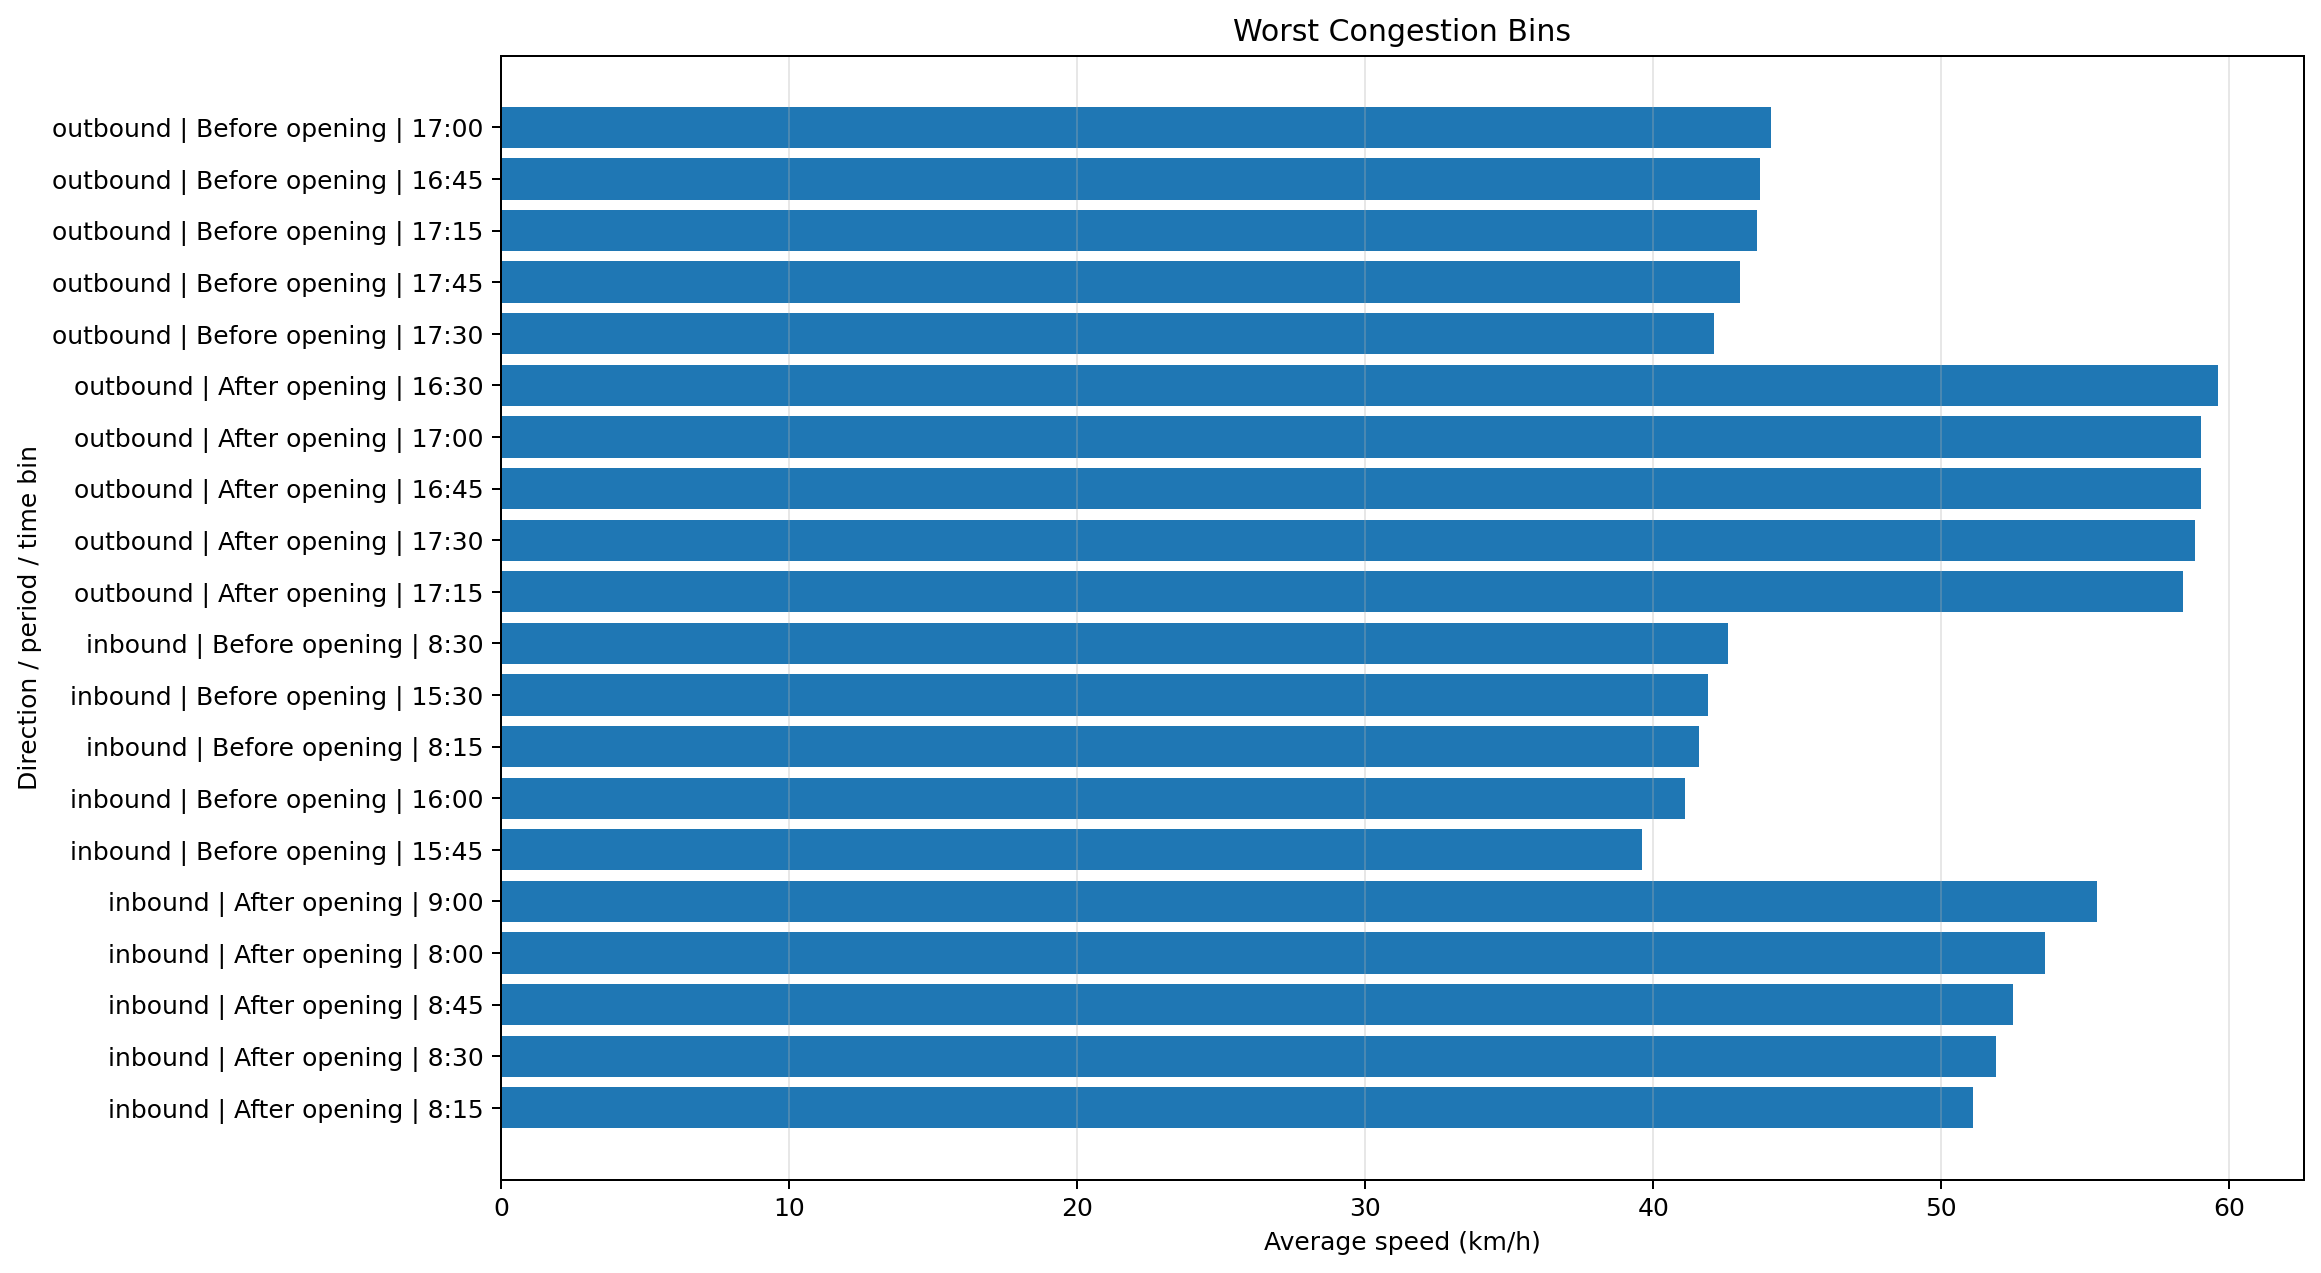
Worst Congestion Bins
Lowest average weekday speeds before and after opening.
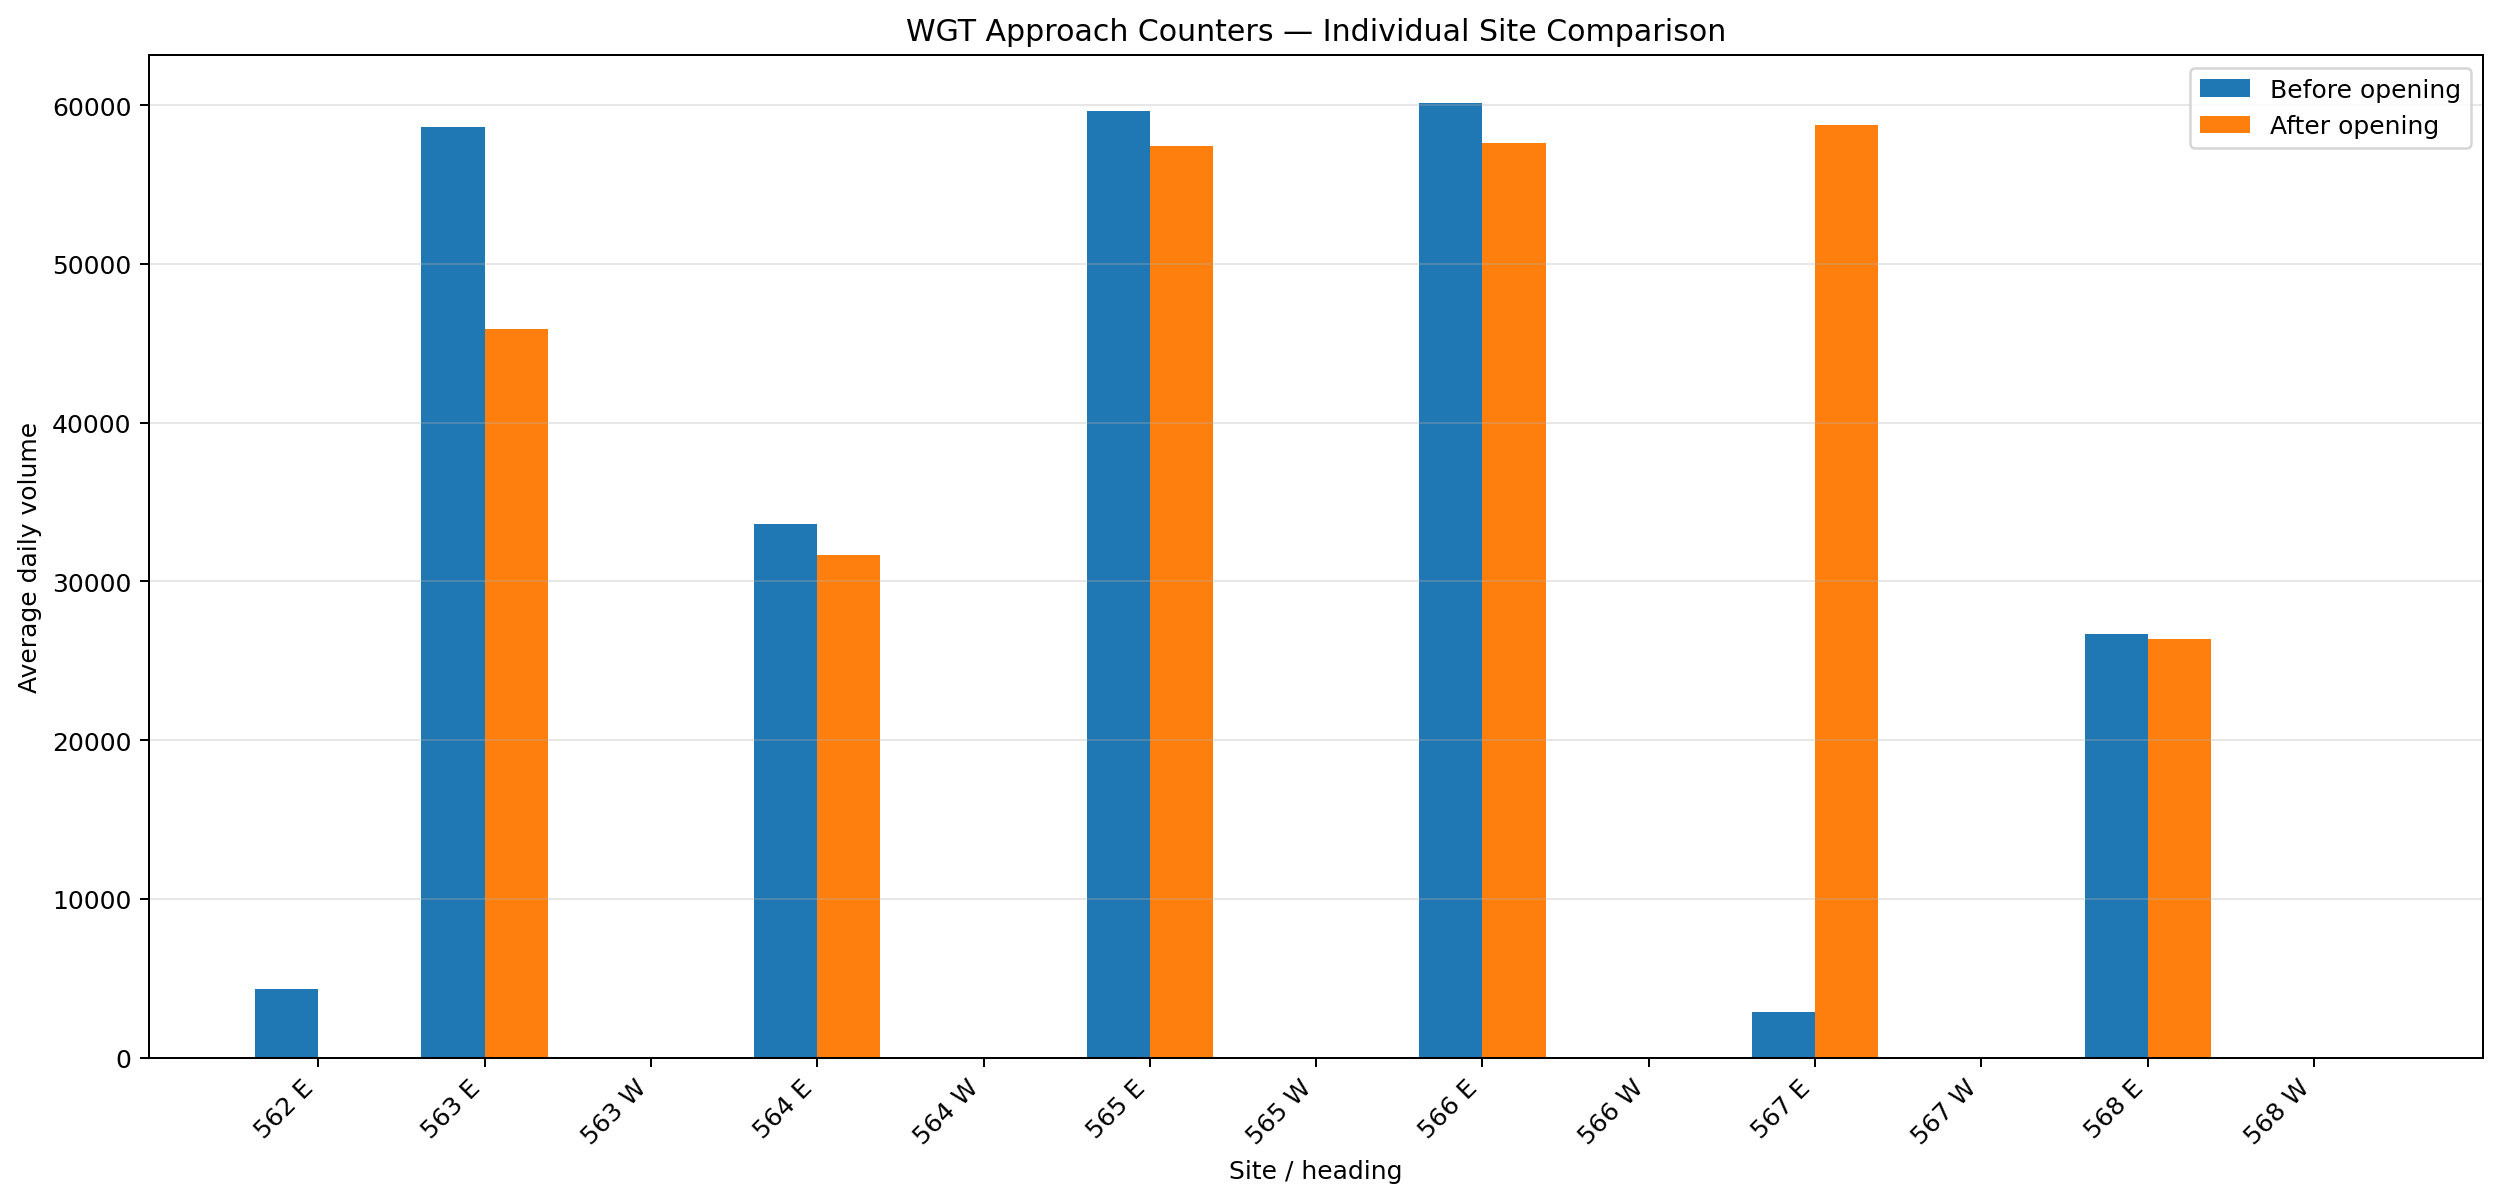
WGT Approach Counters — Individual Site Comparison
Shown individually rather than summed, to avoid double-counting along the same carriageway.
2. Peak-window and truck follow-up
Weekday 7am–9am bridge behaviour and truck participation.
Key takeaway:
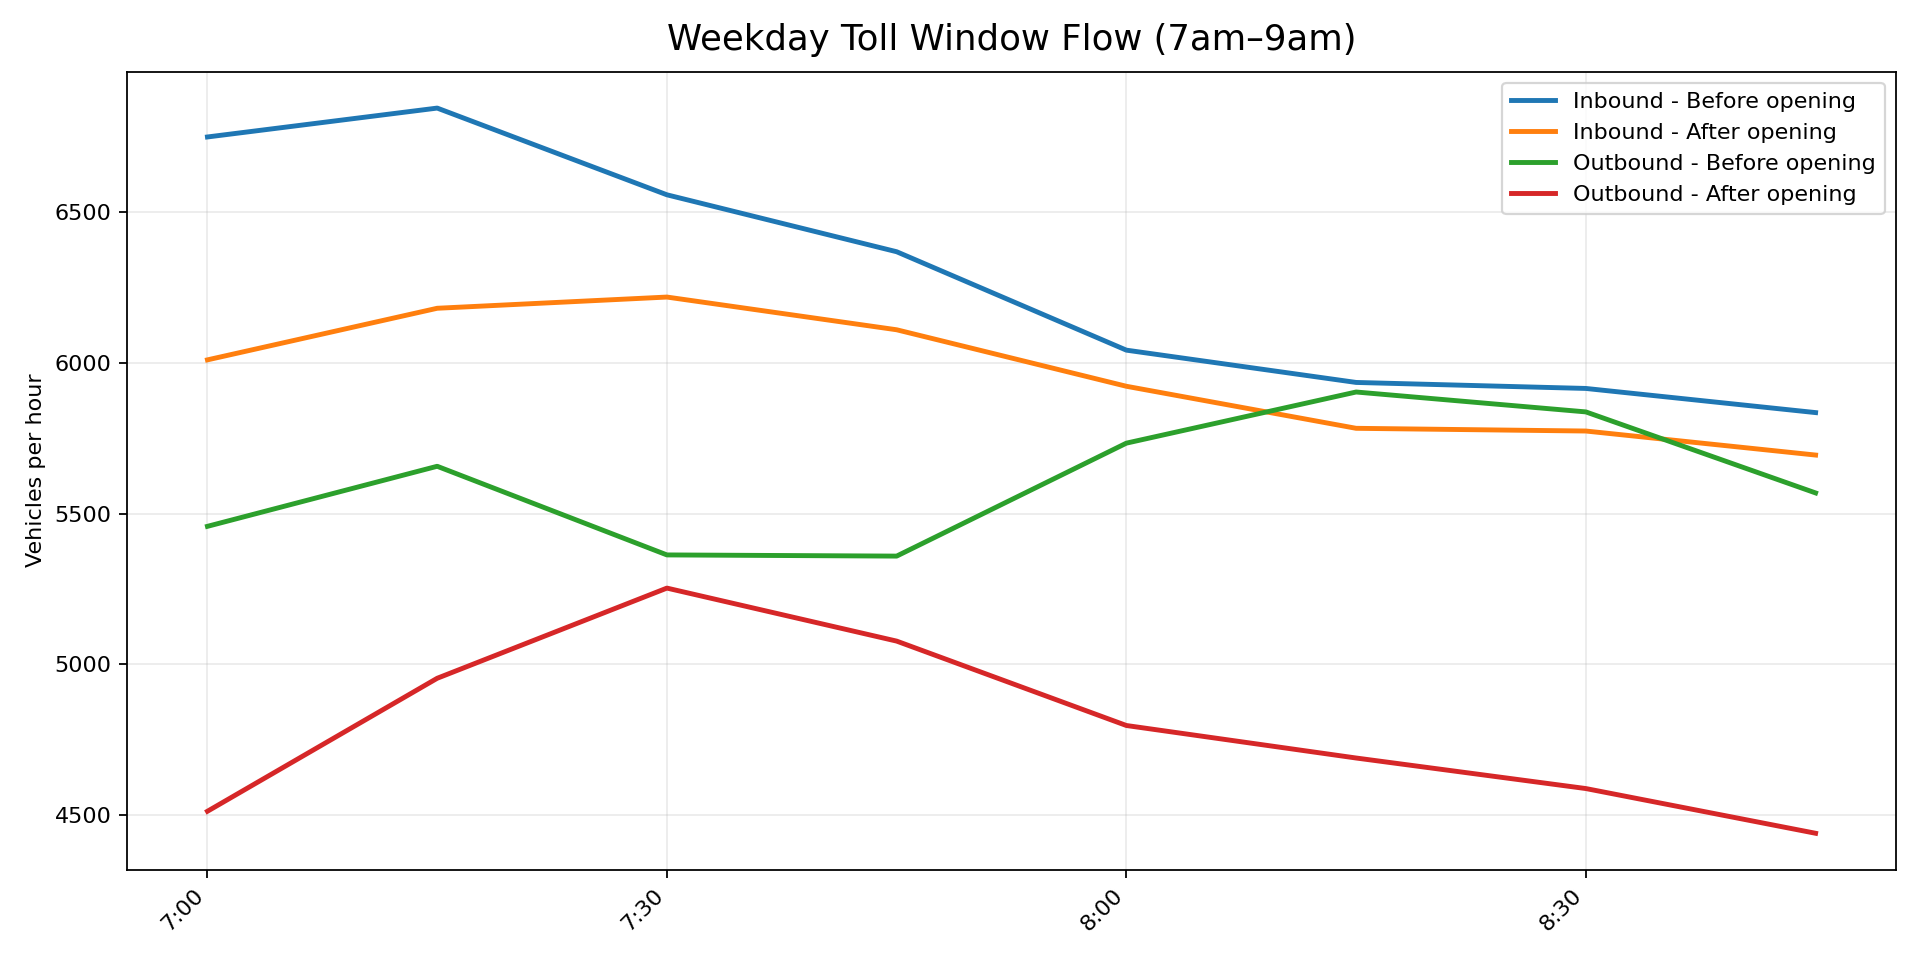
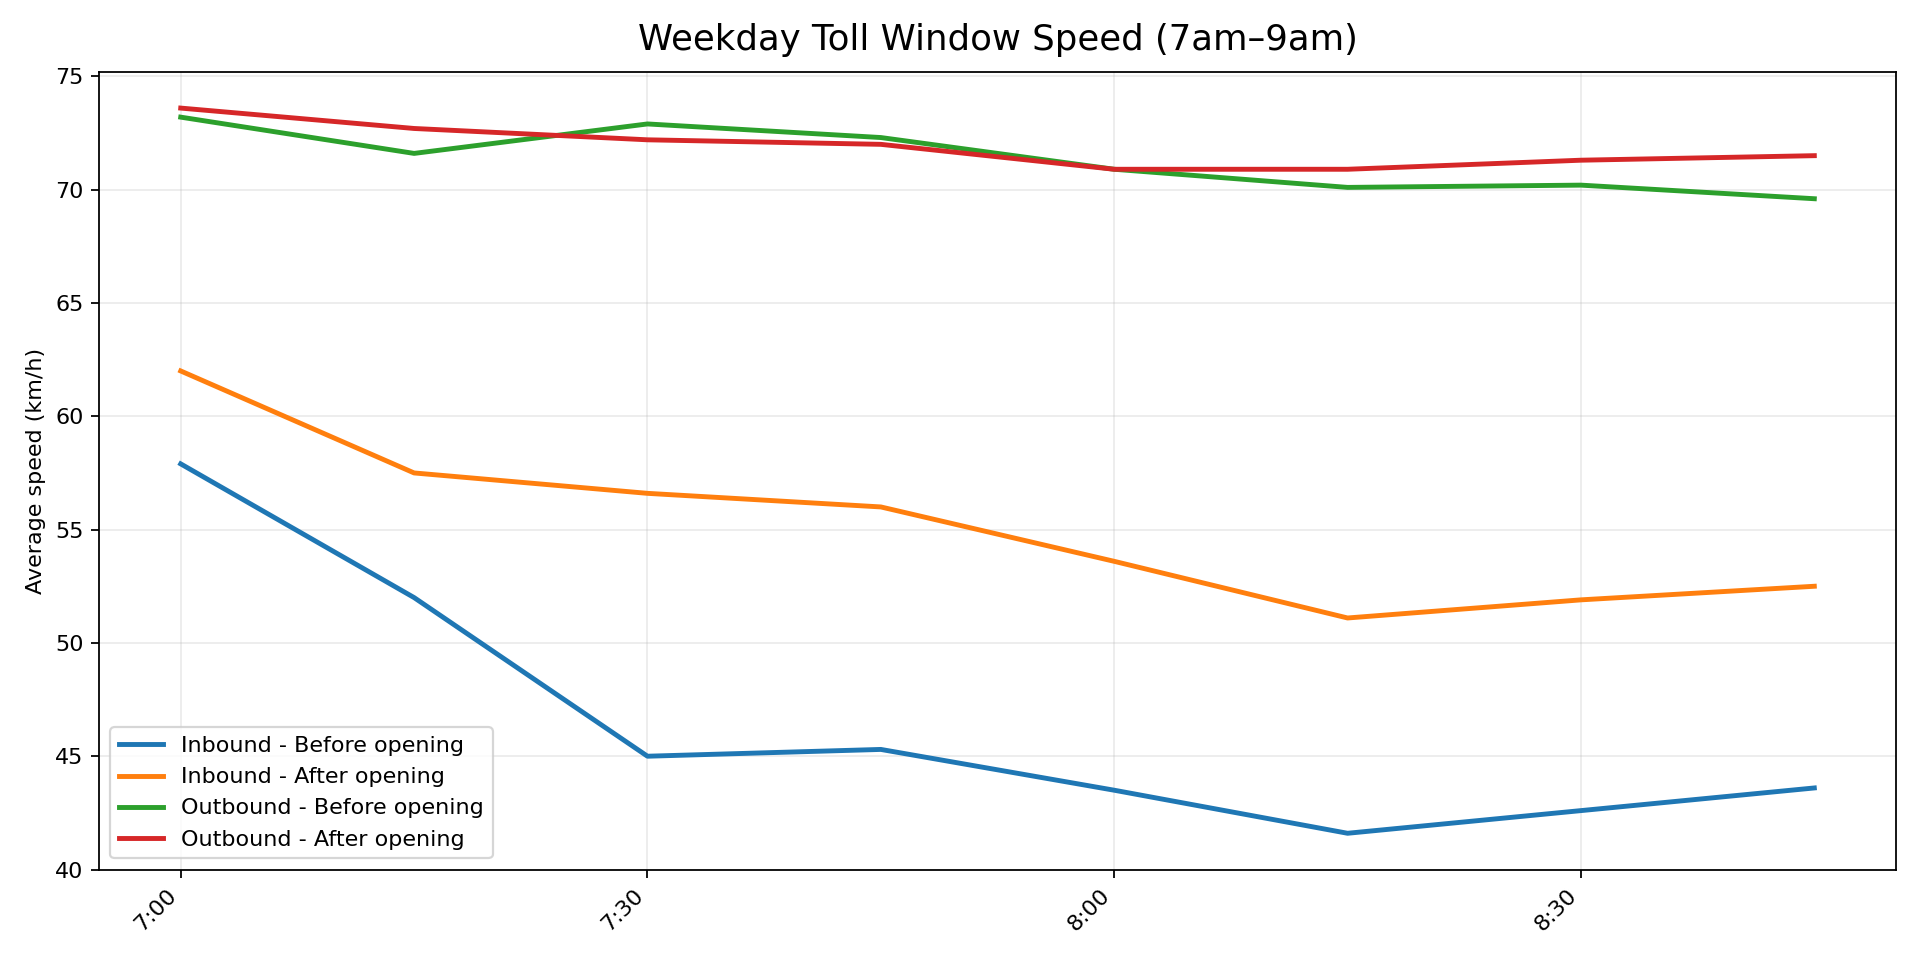
In the early operating period, the West Gate Bridge’s weekday 7am–9am inbound peak appears to have eased after the tunnel opened: average speed rose from 46.4 km/h to 55.1 km/h, while average inbound flow fell from 6,281.1 to 5,961.7 vehicles per hour. Outbound morning speeds changed much less, moving from 71.4 km/h to 71.9 km/h, even as outbound flow fell from 5,610.2 to 4,788.0 vehicles per hour.
Weekday Toll Window Flow
Average bridge flow by 15-minute bin between 7am and 9am, before and after opening.
Weekday Toll Window Speed
Average bridge speed by 15-minute bin between 7am and 9am, before and after opening.
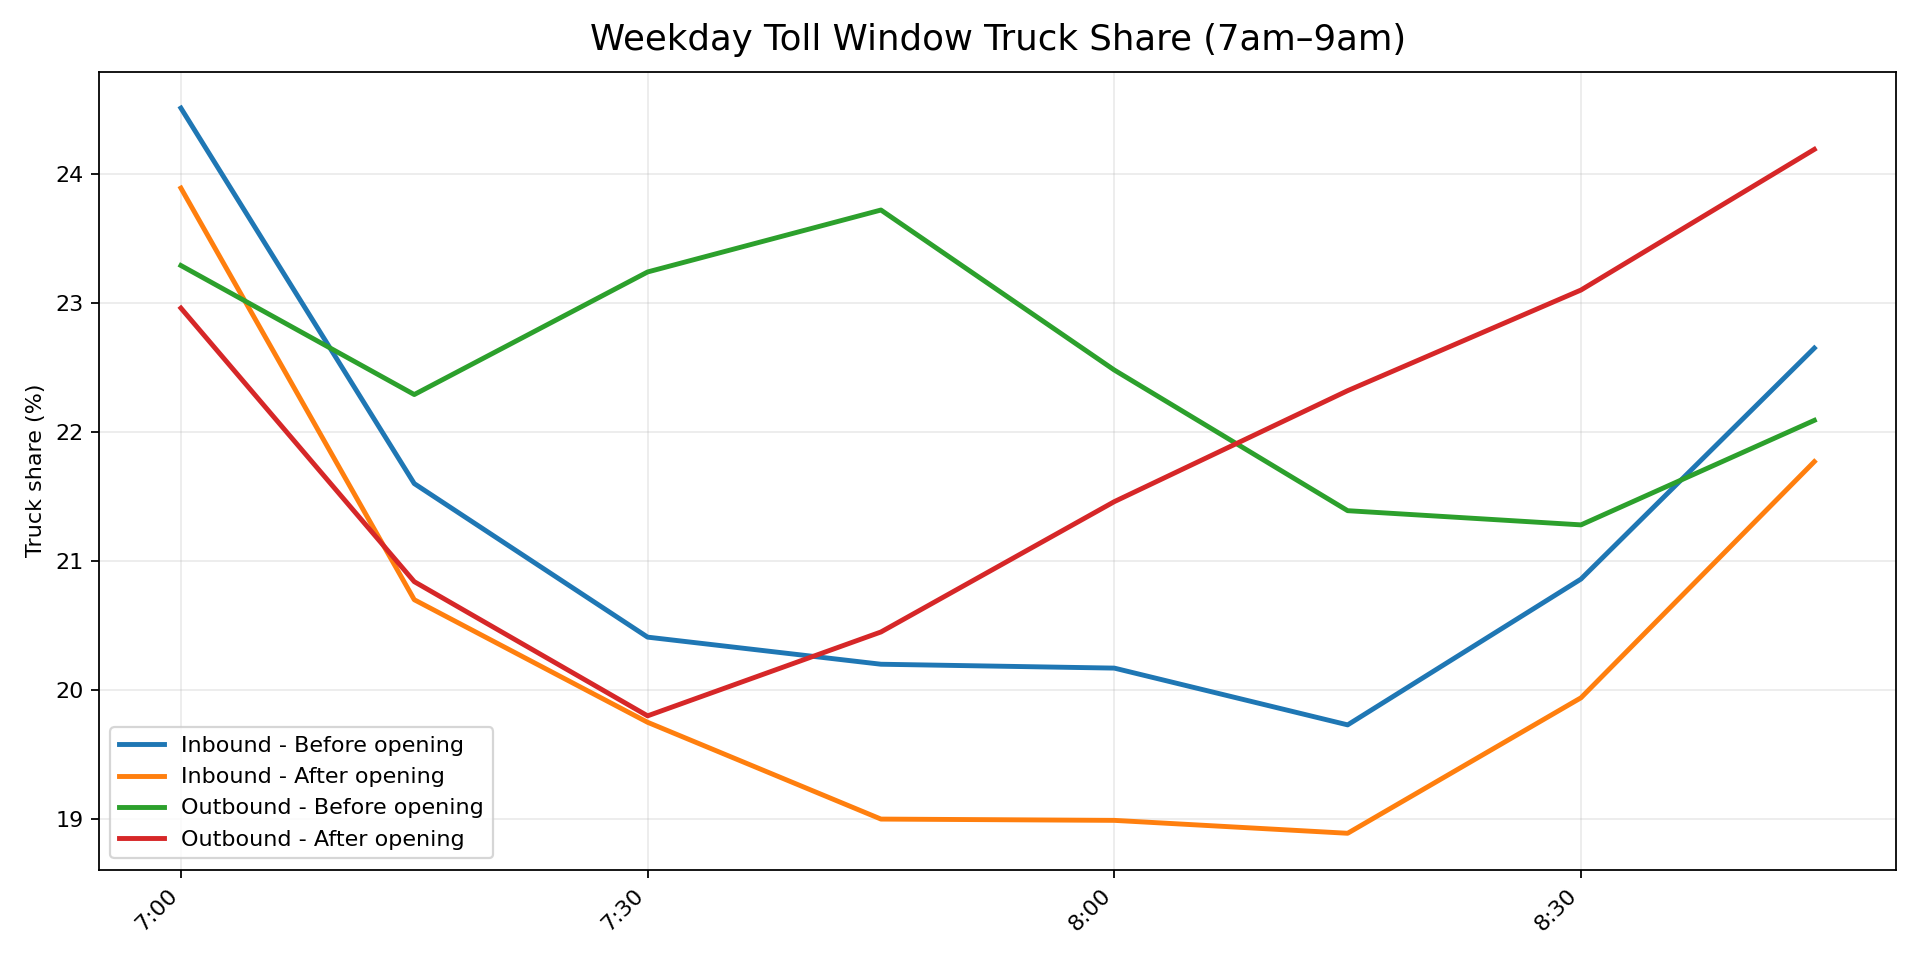
Weekday Toll Window Truck Share
Average truck share by 15-minute bin between 7am and 9am.
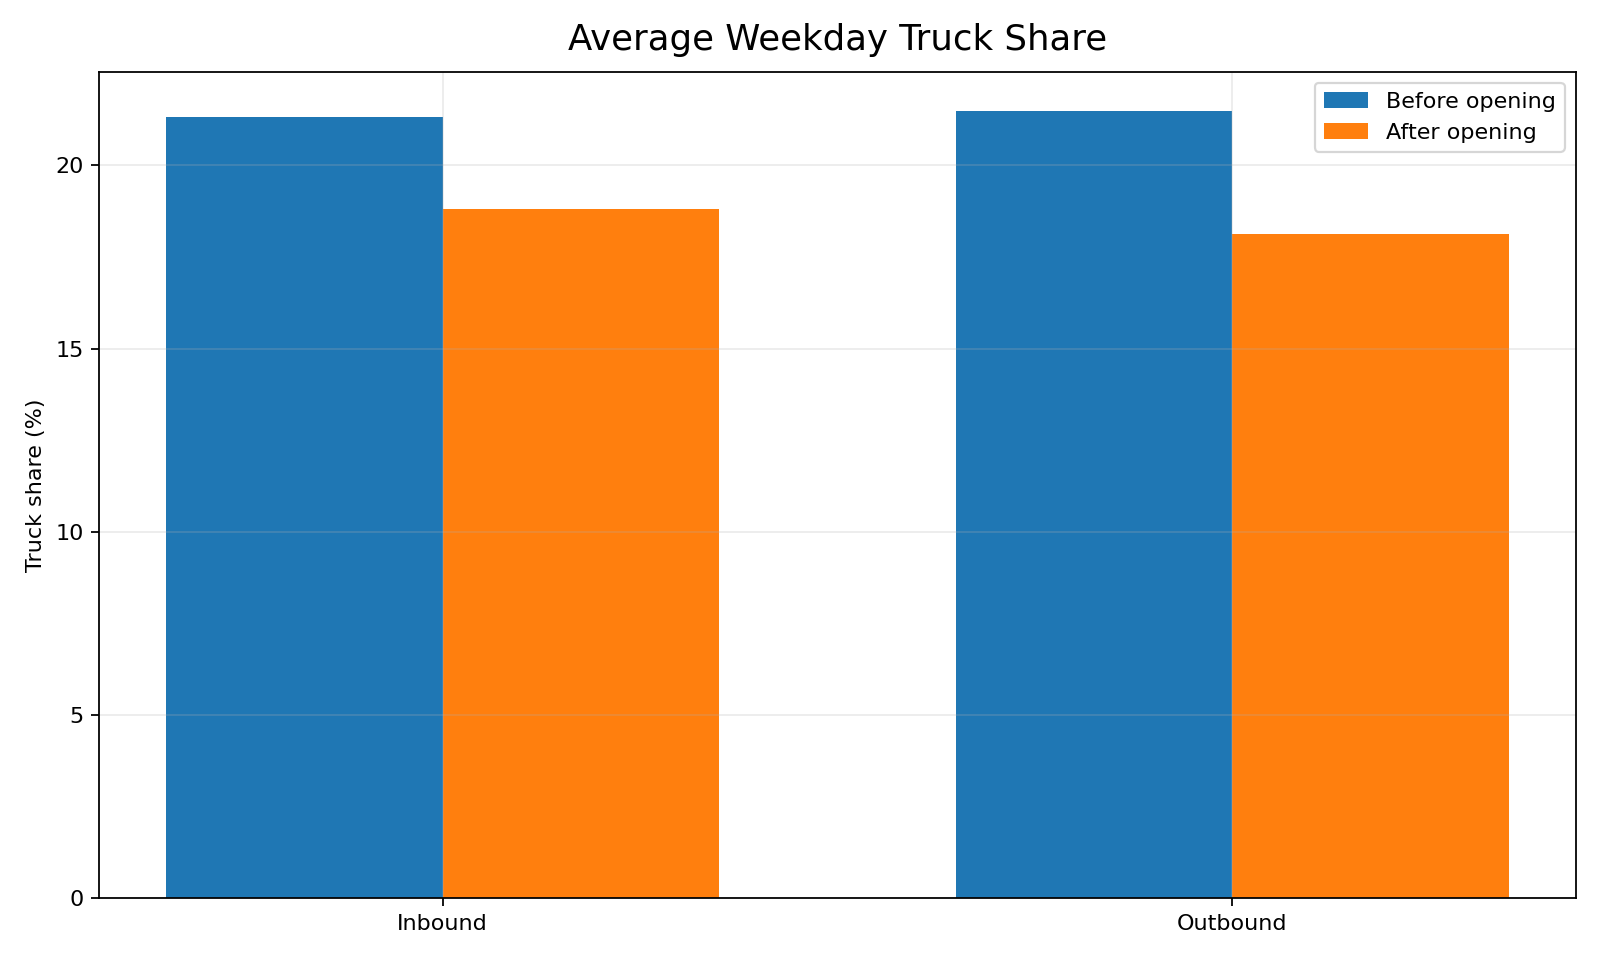
Average Weekday Truck Share
Overall weekday truck share before and after opening, split by direction.
Average Weekday Trucks per Day
Estimated average weekday truck count crossing the bridge per day, by direction.
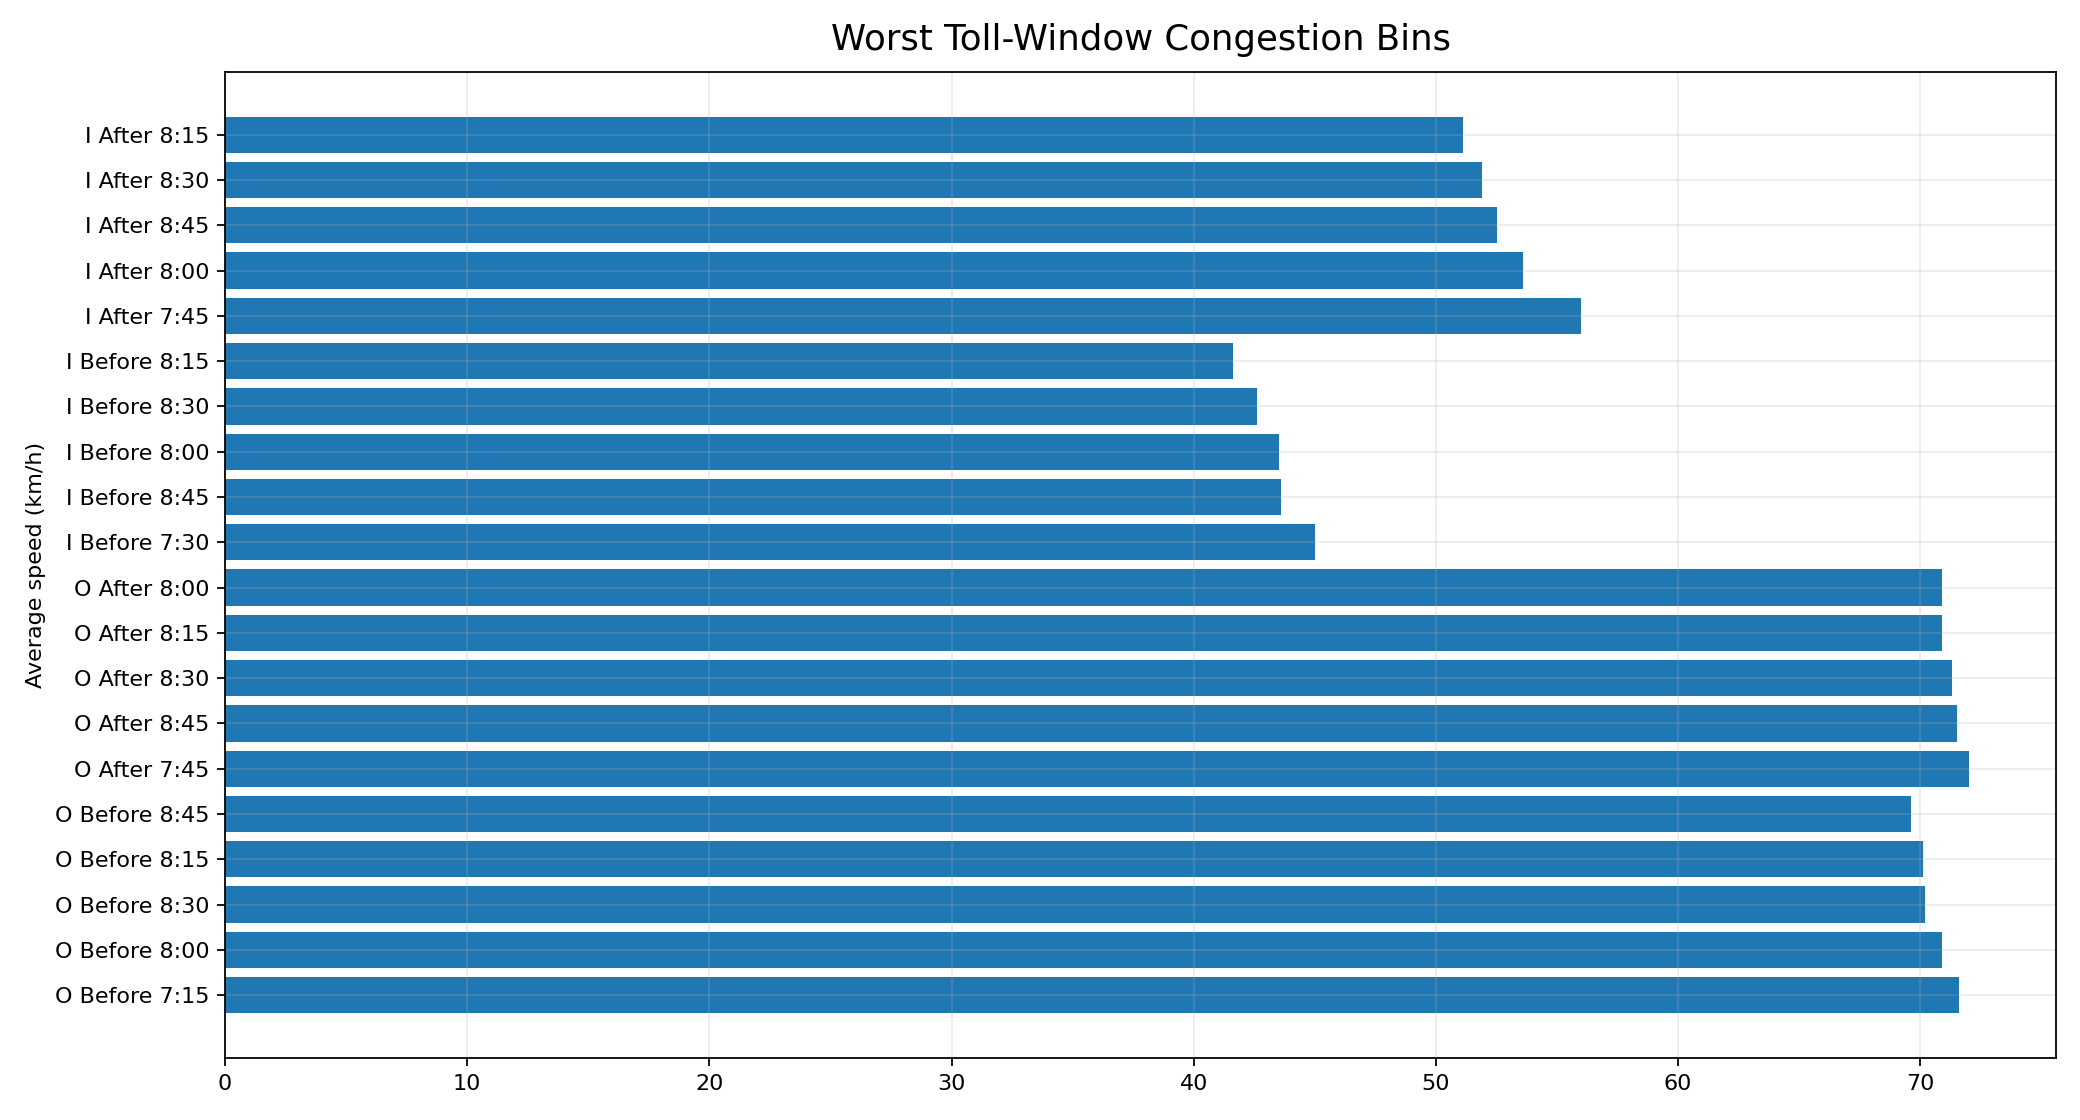
Worst Toll-Window Congestion Bins
Slowest average weekday bins between 7am and 9am in the before-and-after comparison.
3. West Gate ramp / South Wharf corridor analysis
First corridor-level work using validated TIRTL sensors closest to the SCATS-defined area of interest.
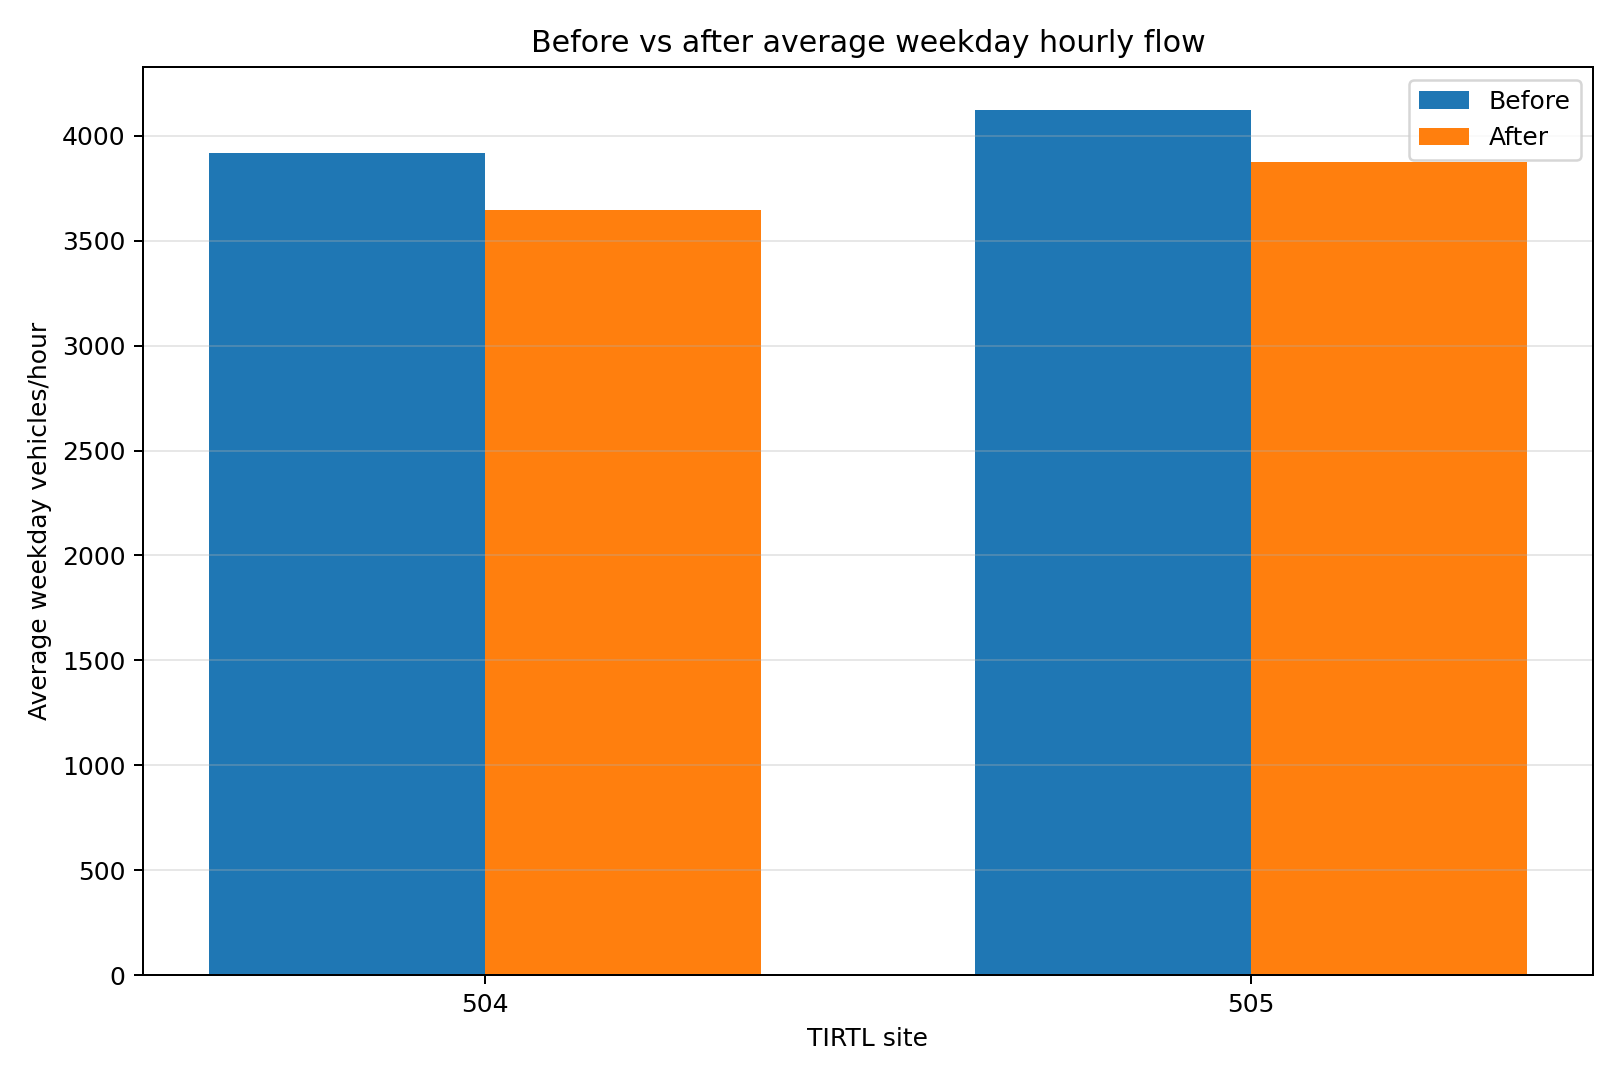
Corridor summary:
The first two validated TIRTL sensors closest to the West Gate ramp / South Wharf corridor show a modest overall decline in average weekday traffic after the tunnel-opening comparison date, and a stronger reduction at several key peak hours.
Strongest interpretation: the early pattern is more consistent with traffic redistribution and softening at selected peak hours than with traffic disappearing altogether.
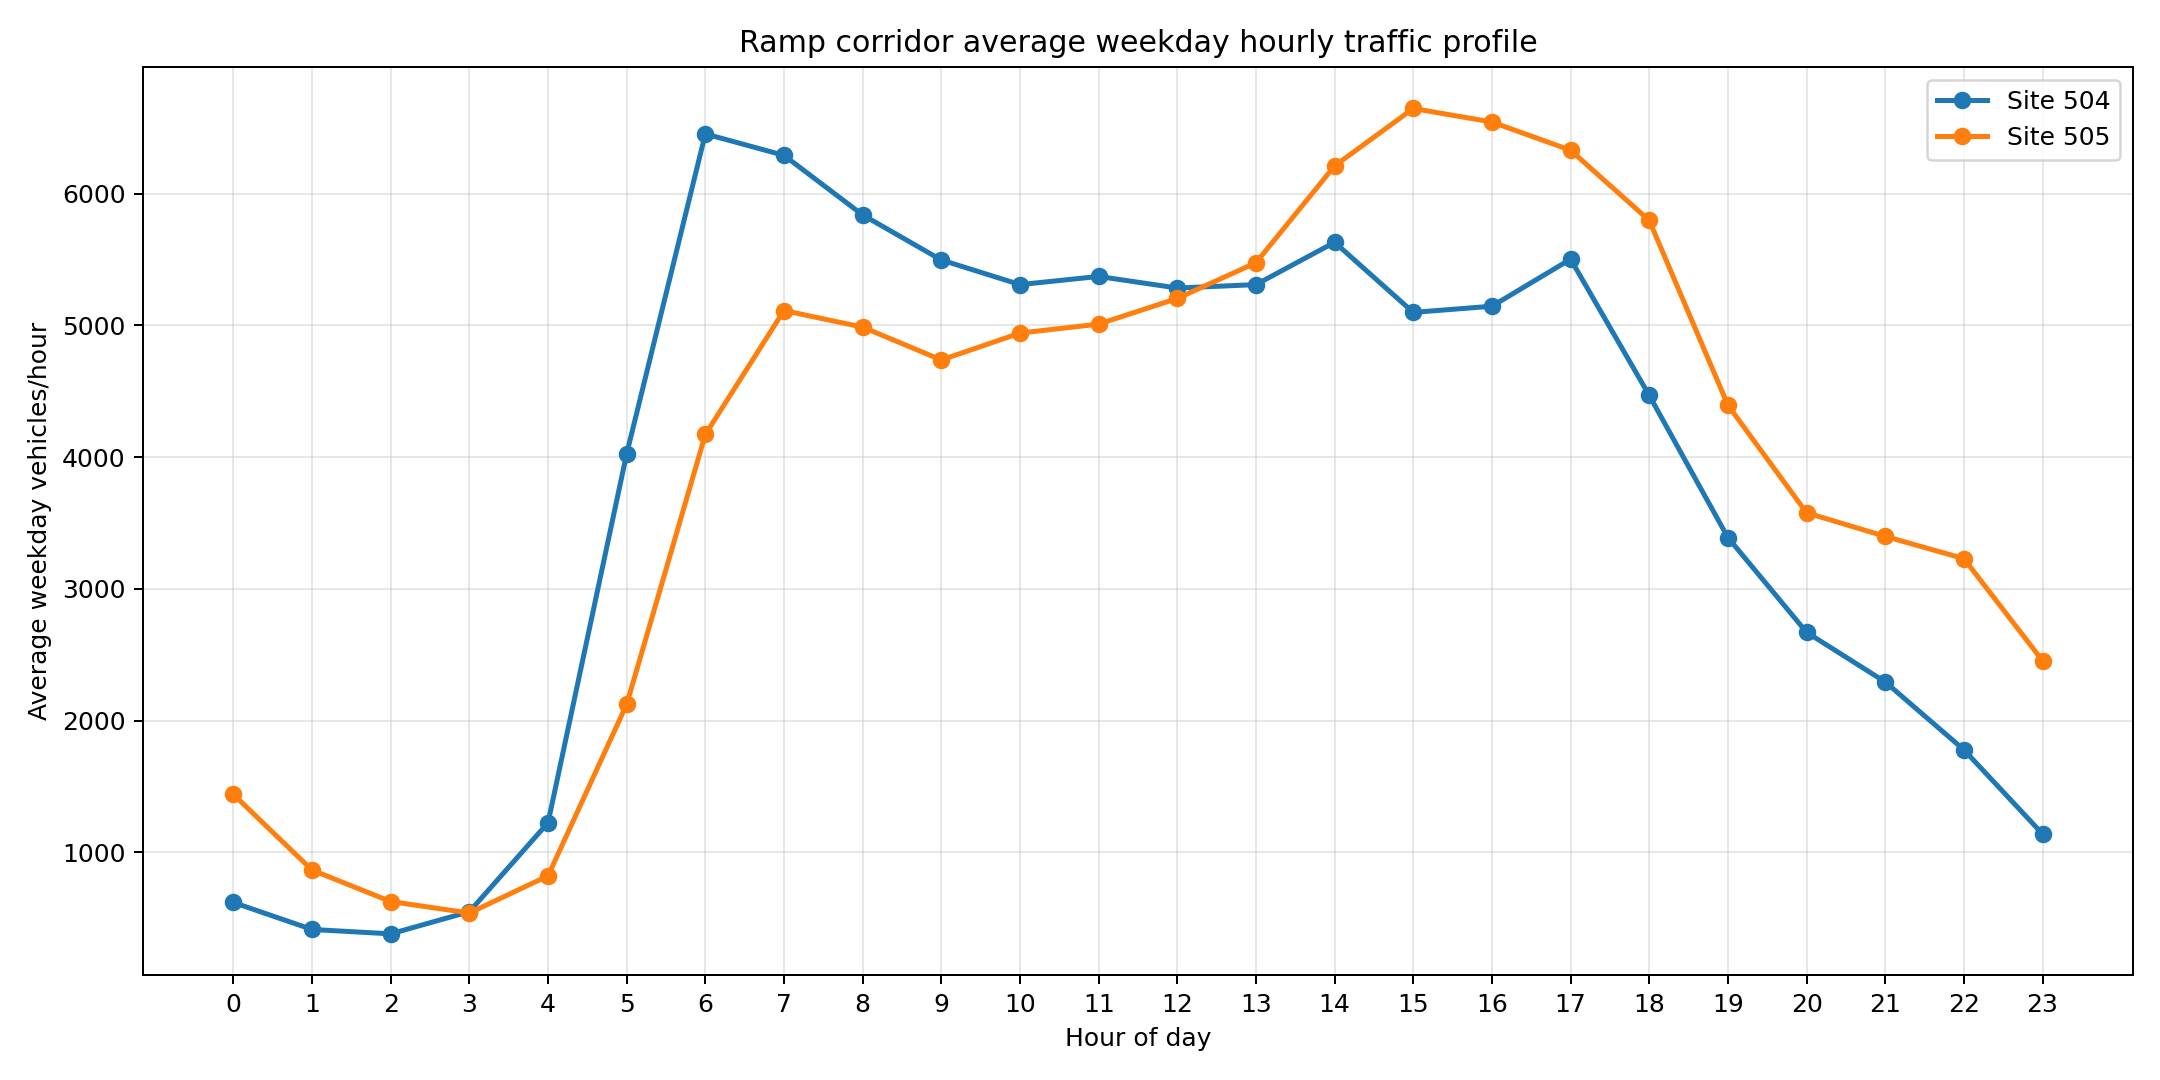
Primary Corridor Sensors
504 and 505
Site 504 Coverage
631,570 rows
Site 505 Coverage
686,644 rows
Date Coverage
2025-11-01 to 2026-03-15
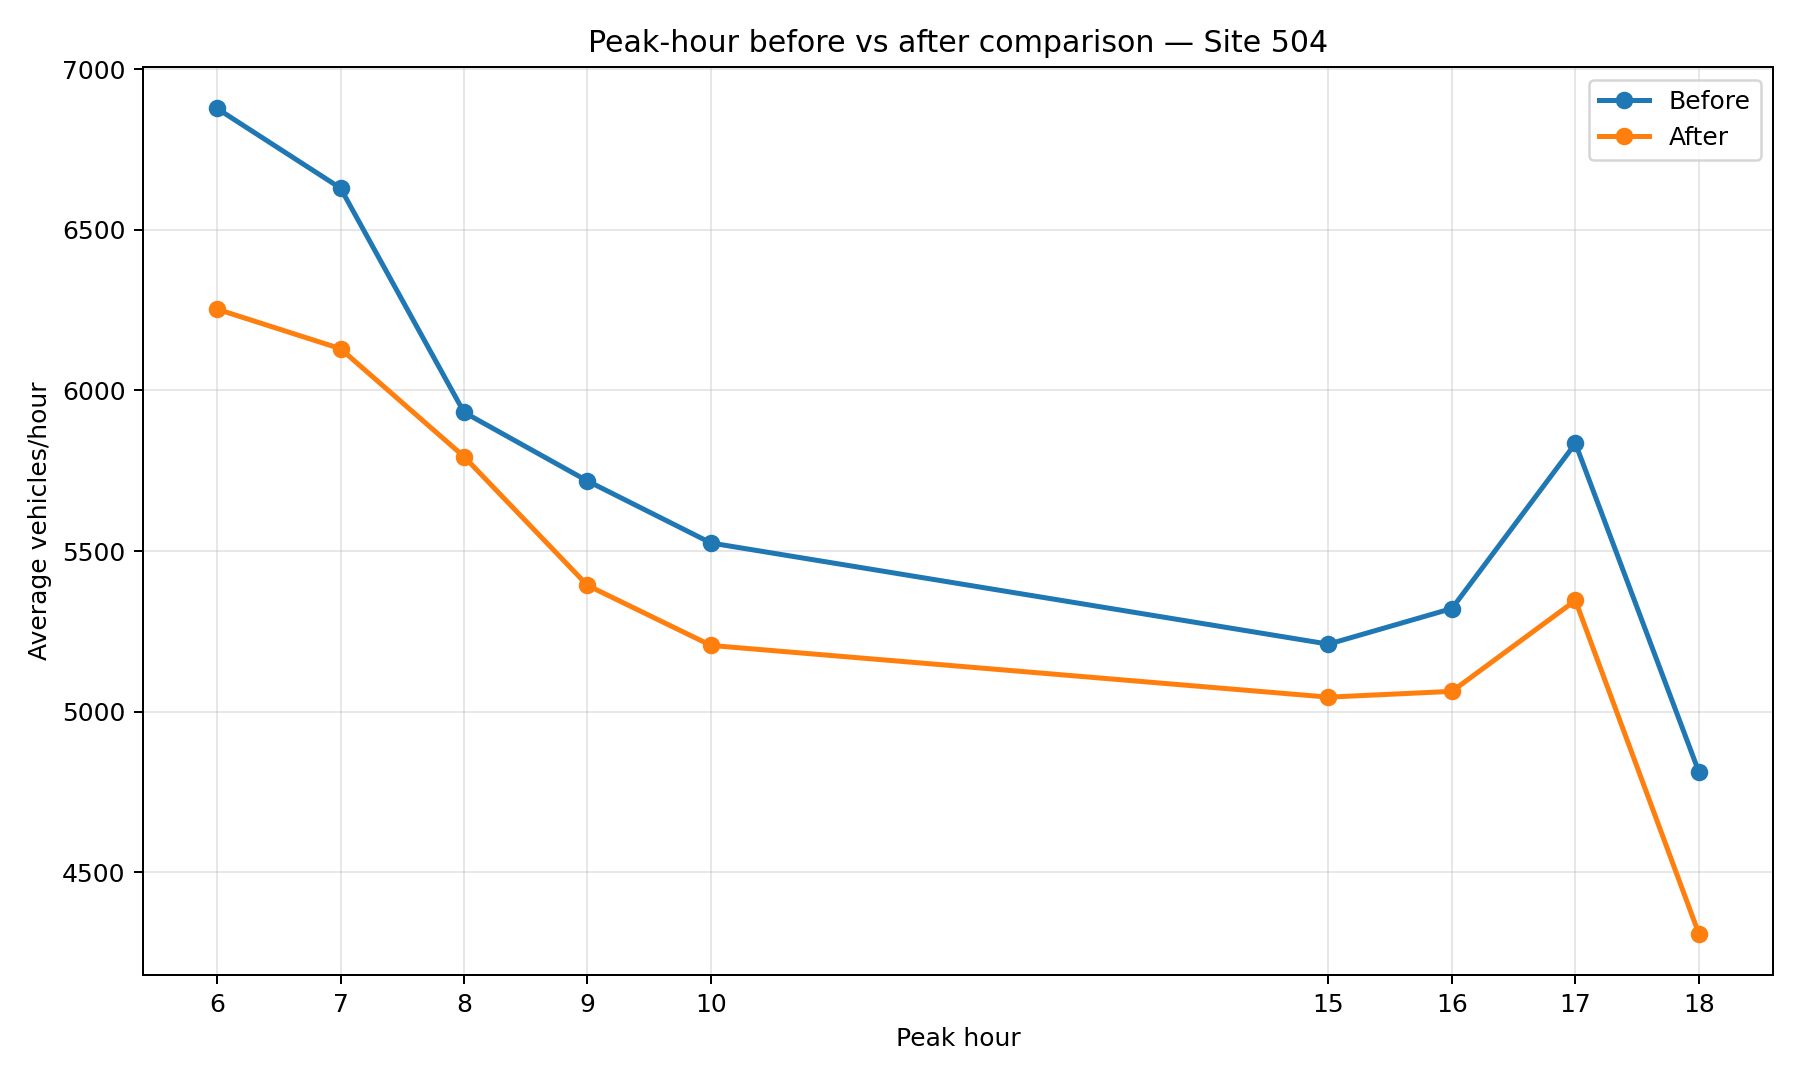
Largest Peak Reduction Seen
~19%
Best read
Peak pressure softened
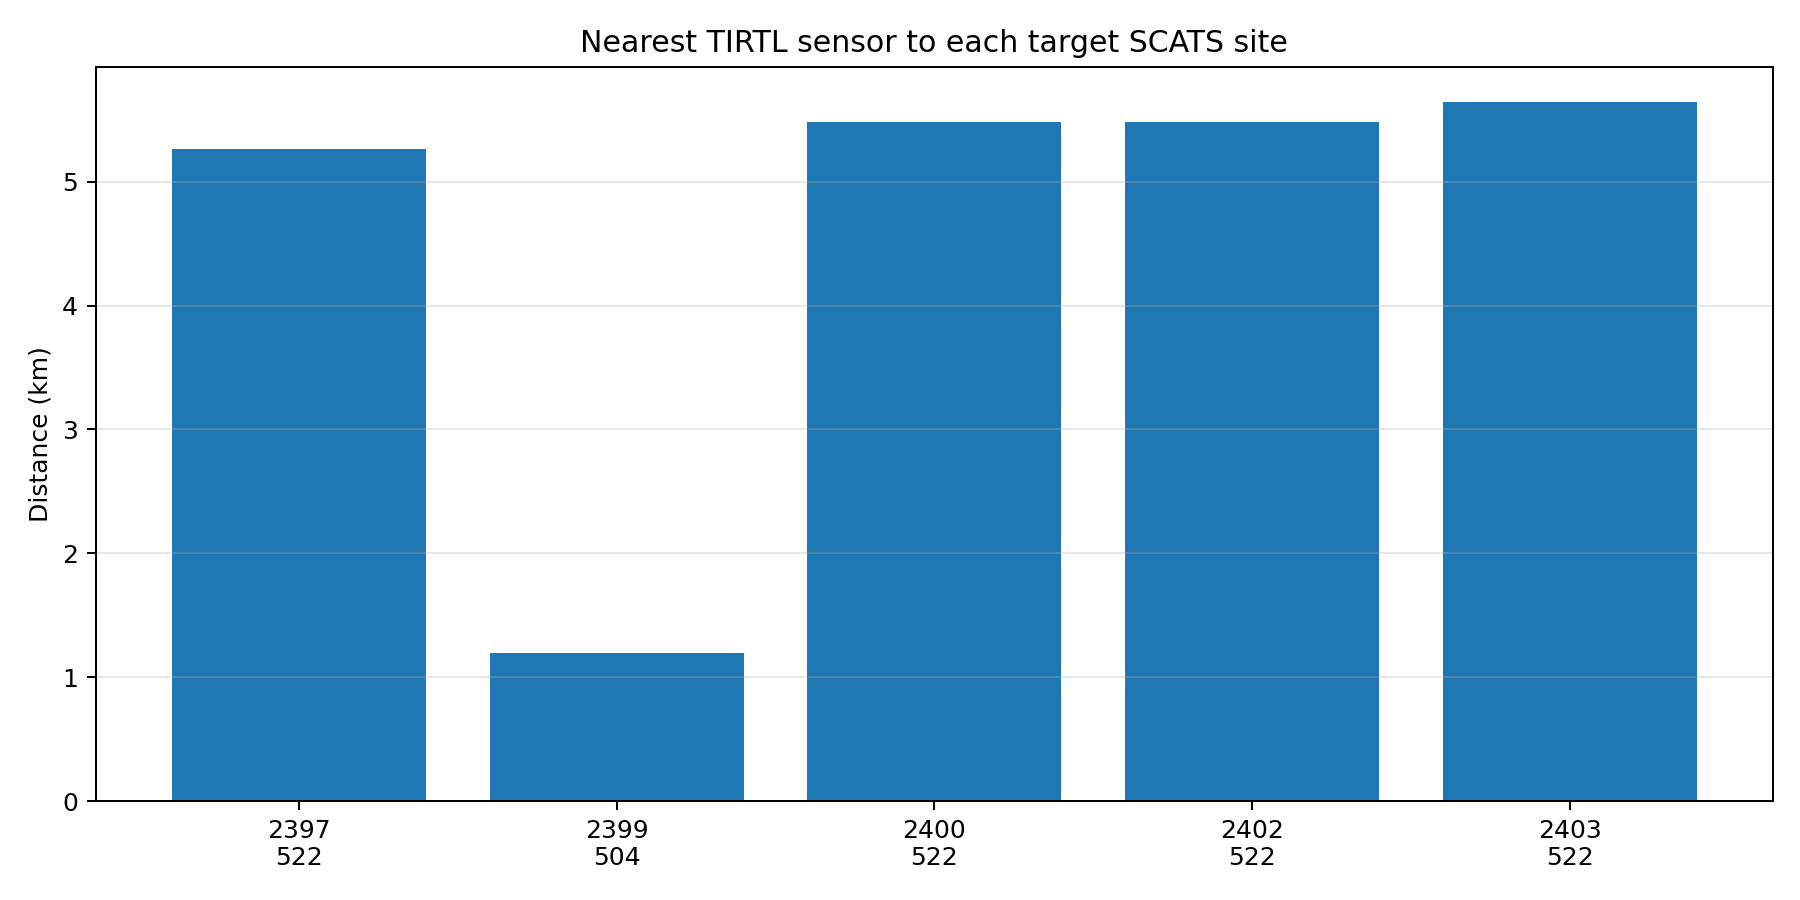
Nearest TIRTL Matches
SCATS-to-TIRTL nearest-site matching results used to define the corridor.
Hourly Profile Weekday
Average weekday hourly flow profile for the selected corridor sensors.
Before / After Weekday
Average weekday hourly traffic before and after the split date.
Peak Before / After – Site 504
Peak-hour comparison for the first ramp-adjacent validated sensor.
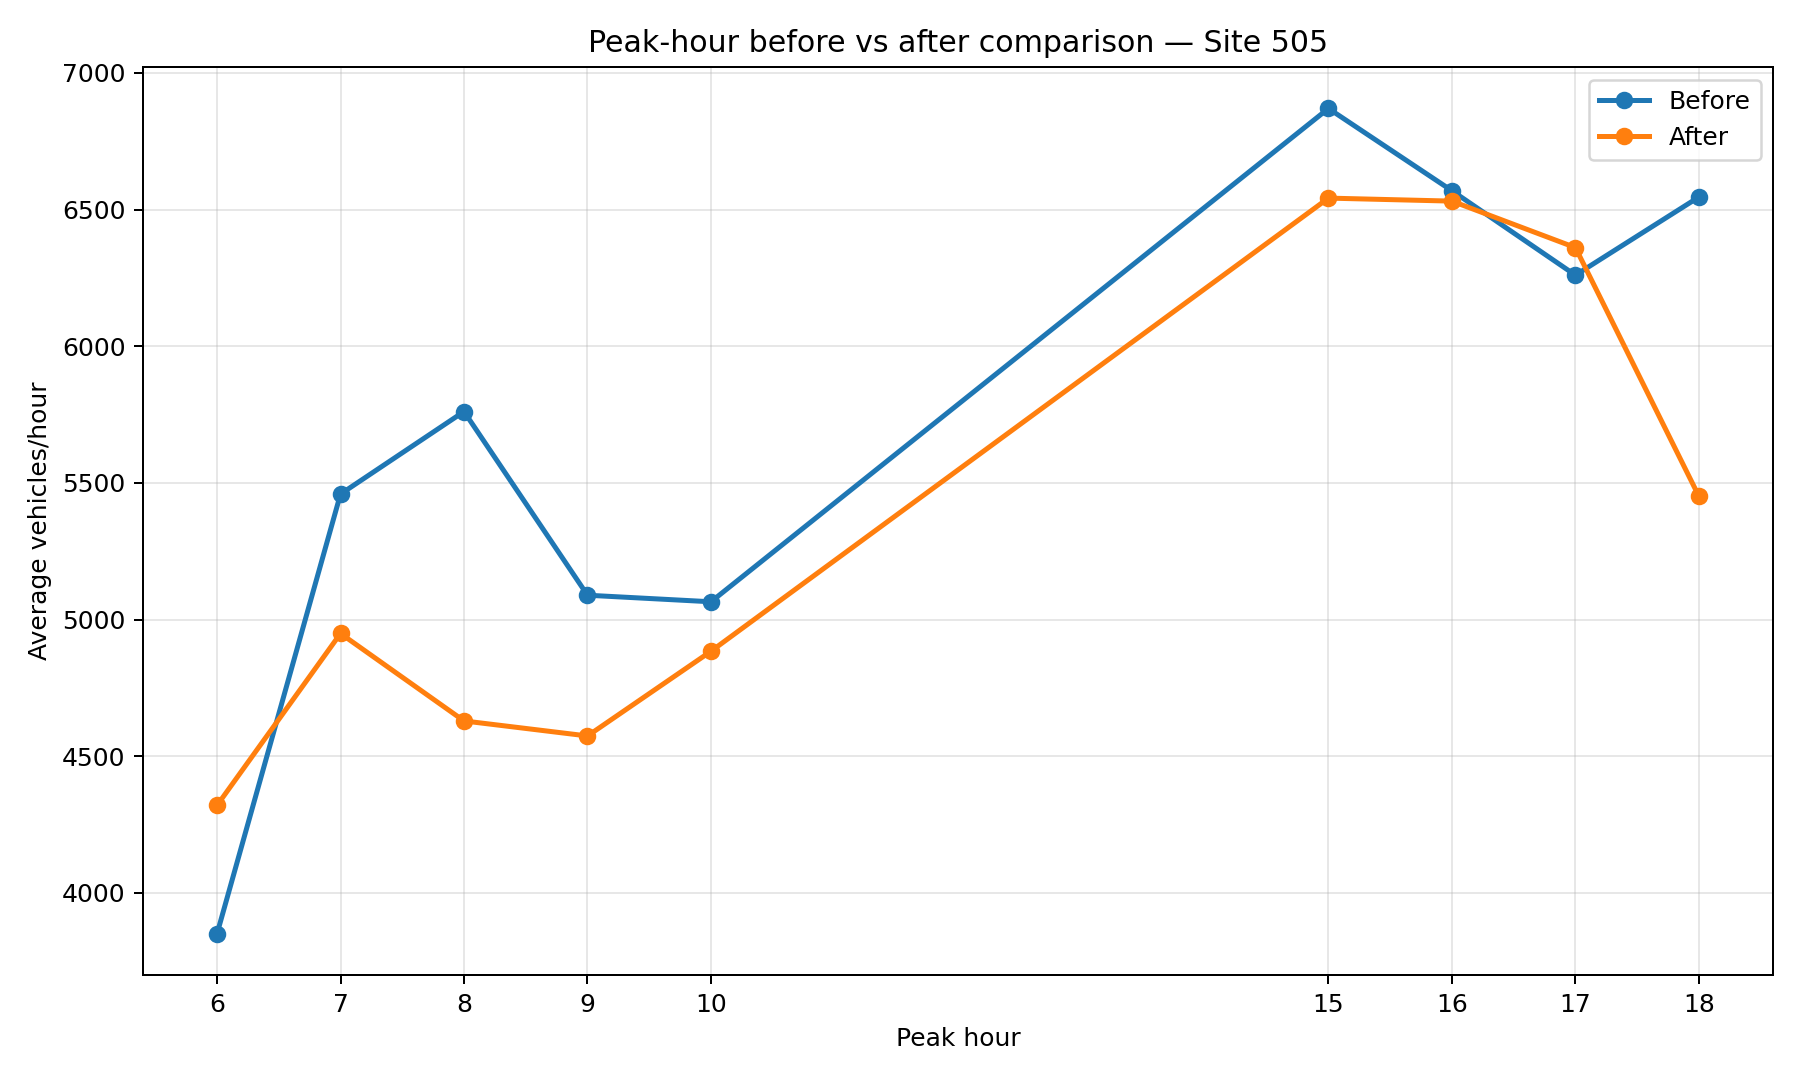
Peak Before / After – Site 505
Peak-hour comparison for the second ramp-adjacent validated sensor.
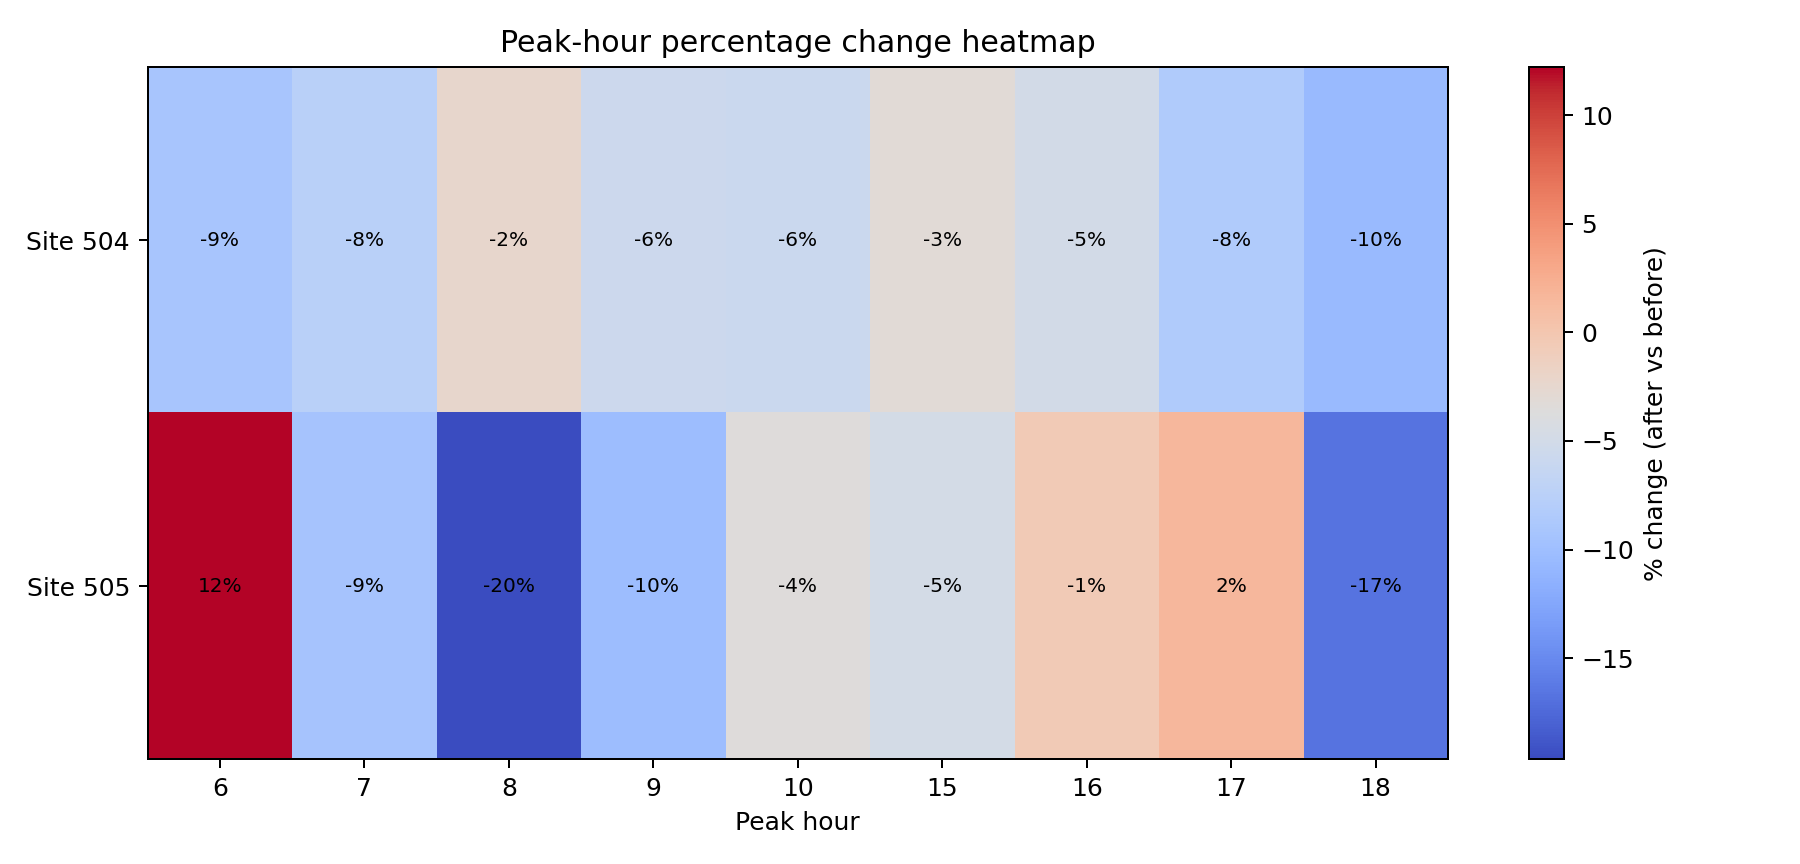
Peak % Change Heatmap
Fast visual read of where the largest percentage changes occurred.
Method notes and caveats
What is established well
- The bridge is carrying fewer weekday vehicles than before the opening split.
- The weekday 7am–9am inbound bridge peak improved in speed and softened in volume.
- Truck participation on the bridge appears to have decreased in the early operating period.
- The first validated South Wharf / ramp-adjacent corridor sensors show moderate overall reductions and stronger softening at selected peak hours.
Database Overview
Database
westgate_tirtl.db
Approx total rows
132,389,534
Date range
2025-11-01 to 2026-03-15
Bridge Summary
Average volume/hour
3,750.7
Average vehicles/15m
937.7
Maximum volume/hour
10,484
Average truck share
17.32%
Maximum truck share
61.86%
Baseline Divergence Summary
Average actual VPH
3,750.7
Average baseline VPH
3,750.7
% intervals above +10%
24.5%
% intervals above +20%
8.3%
% intervals above +30%
3.6%
Average actual speed
67.9 km/h
Average baseline speed
67.9 km/h
Direction Split
Inbound vs outbound bridge operating profile.
| Direction | Rows | Avg VPH | Max VPH | Avg Speed | Min Speed | Avg Truck % |
|---|
| inbound | 12,854 | 3,659.3 | 8,252 | 67.4 km/h | 16.3 km/h | 18.23% |
| outbound | 12,913 | 3,841.8 | 10,484 | 68.4 km/h | 13.8 km/h | 16.43% |
Peak Bridge Intervals
Top 25 bridge intervals ranked by vehicles/hour.
| Date | Time | Direction | Vehicles/15m | Vehicles/Hour | Truck/15m | Truck % | Avg Speed |
|---|
| 2025-12-16 | 10:00 | outbound | 2,621 | 10,484 | 809 | 30.87% | 60.2 km/h |
| 2026-01-13 | 15:45 | outbound | 2,076 | 8,304 | 364 | 17.53% | 60.0 km/h |
| 2025-12-19 | 17:00 | outbound | 2,075 | 8,300 | 266 | 12.82% | 68.7 km/h |
| 2026-01-13 | 7:30 | inbound | 2,063 | 8,252 | 373 | 18.08% | 59.1 km/h |
| 2025-11-14 | 6:15 | inbound | 2,062 | 8,248 | 499 | 24.20% | 66.0 km/h |
| 2025-11-06 | 18:00 | outbound | 2,042 | 8,168 | 293 | 14.35% | 51.1 km/h |
| 2025-12-08 | 18:15 | outbound | 2,040 | 8,160 | 260 | 12.75% | 49.9 km/h |
| 2025-11-27 | 6:30 | inbound | 2,036 | 8,144 | 527 | 25.88% | 59.9 km/h |
| 2025-11-20 | 6:30 | inbound | 2,033 | 8,132 | 509 | 25.04% | 62.1 km/h |
| 2026-01-14 | 16:15 | outbound | 2,033 | 8,132 | 268 | 13.18% | 61.6 km/h |
| 2026-03-04 | 6:15 | inbound | 2,031 | 8,124 | 444 | 21.86% | 66.4 km/h |
| 2026-01-13 | 16:00 | outbound | 2,029 | 8,116 | 314 | 15.48% | 66.7 km/h |
| 2026-01-20 | 6:30 | inbound | 2,014 | 8,056 | 540 | 26.81% | 64.4 km/h |
| 2025-12-16 | 6:15 | inbound | 2,012 | 8,048 | 501 | 24.90% | 68.9 km/h |
| 2026-02-26 | 6:30 | inbound | 2,012 | 8,048 | 498 | 24.75% | 59.6 km/h |
| 2025-11-10 | 6:30 | inbound | 2,008 | 8,032 | 481 | 23.95% | 66.9 km/h |
| 2026-02-19 | 6:15 | inbound | 2,008 | 8,032 | 460 | 22.91% | 63.0 km/h |
| 2026-01-13 | 15:15 | outbound | 2,004 | 8,016 | 396 | 19.76% | 64.0 km/h |
| 2026-02-23 | 17:15 | outbound | 2,003 | 8,012 | 224 | 11.18% | 55.9 km/h |
| 2026-03-03 | 16:15 | outbound | 2,003 | 8,012 | 321 | 16.03% | 54.0 km/h |
| 2026-02-09 | 7:45 | inbound | 2,000 | 8,000 | 354 | 17.70% | 60.2 km/h |
| 2026-02-03 | 6:30 | inbound | 1,993 | 7,972 | 503 | 25.24% | 66.2 km/h |
| 2026-01-14 | 16:00 | outbound | 1,991 | 7,964 | 296 | 14.87% | 63.5 km/h |
| 2026-03-03 | 16:30 | outbound | 1,991 | 7,964 | 305 | 15.32% | 63.6 km/h |
| 2026-02-09 | 7:30 | inbound | 1,990 | 7,960 | 353 | 17.74% | 61.1 km/h |
Slowest Bridge Intervals
Top 25 bridge intervals ranked by lowest observed speed.
| Date | Time | Direction | Vehicles/Hour | Truck/15m | Truck % | Avg Speed |
|---|
| 2026-01-15 | 17:30 | outbound | 2,636 | 106 | 16.08% | 13.8 km/h |
| 2026-01-15 | 17:45 | outbound | 3,216 | 121 | 15.05% | 15.5 km/h |
| 2025-12-12 | 19:30 | outbound | 3,076 | 132 | 17.17% | 15.6 km/h |
| 2026-01-15 | 17:15 | outbound | 2,948 | 113 | 15.33% | 15.7 km/h |
| 2025-12-12 | 19:15 | outbound | 3,120 | 142 | 18.21% | 15.9 km/h |
| 2025-12-12 | 19:45 | outbound | 3,032 | 145 | 19.13% | 16.3 km/h |
| 2026-02-14 | 18:15 | inbound | 3,420 | 63 | 7.37% | 16.3 km/h |
| 2026-01-15 | 18:00 | outbound | 3,300 | 117 | 14.18% | 16.4 km/h |
| 2025-11-02 | 14:45 | outbound | 1,724 | 57 | 13.23% | 16.7 km/h |
| 2025-12-18 | 15:00 | inbound | 3,104 | 145 | 18.69% | 17.1 km/h |
| 2025-11-02 | 15:00 | outbound | 2,184 | 57 | 10.44% | 17.2 km/h |
| 2026-01-23 | 15:30 | inbound | 3,708 | 169 | 18.23% | 17.9 km/h |
| 2026-02-06 | 16:30 | inbound | 3,720 | 156 | 16.77% | 17.9 km/h |
| 2026-02-14 | 18:30 | inbound | 3,688 | 65 | 7.05% | 17.9 km/h |
| 2025-12-28 | 8:45 | outbound | 1,956 | 50 | 10.22% | 18.0 km/h |
| 2026-02-14 | 18:00 | inbound | 3,652 | 65 | 7.12% | 18.2 km/h |
| 2026-01-12 | 12:15 | inbound | 3,316 | 210 | 25.33% | 18.6 km/h |
| 2025-12-12 | 14:45 | inbound | 3,804 | 227 | 23.87% | 19.4 km/h |
| 2025-12-03 | 16:00 | inbound | 4,040 | 195 | 19.31% | 19.8 km/h |
| 2025-12-20 | 18:00 | inbound | 3,560 | 86 | 9.66% | 19.9 km/h |
| 2026-01-23 | 13:15 | inbound | 3,924 | 232 | 23.65% | 19.9 km/h |
| 2026-02-06 | 16:45 | inbound | 4,216 | 130 | 12.33% | 19.9 km/h |
| 2025-12-28 | 20:45 | outbound | 2,060 | 40 | 7.77% | 20.0 km/h |
| 2025-11-30 | 15:45 | outbound | 3,116 | 69 | 8.86% | 20.1 km/h |
| 2026-01-15 | 17:00 | outbound | 3,660 | 149 | 16.28% | 20.1 km/h |
Slowest High-Volume Bridge Intervals
Congestion-focused low-speed list, restricted to intervals at or above 4,000 vehicles/hour.
| Date | Time | Direction | Vehicles/Hour | Truck/15m | Truck % | Avg Speed |
|---|
| 2025-12-03 | 16:00 | inbound | 4,040 | 195 | 19.31% | 19.8 km/h |
| 2026-02-06 | 16:45 | inbound | 4,216 | 130 | 12.33% | 19.9 km/h |
| 2025-11-27 | 15:30 | inbound | 4,420 | 208 | 18.82% | 20.2 km/h |
| 2025-12-04 | 15:45 | inbound | 4,720 | 212 | 17.97% | 20.3 km/h |
| 2025-12-05 | 14:00 | inbound | 4,064 | 237 | 23.33% | 20.5 km/h |
| 2025-12-05 | 16:00 | inbound | 4,252 | 198 | 18.63% | 20.7 km/h |
| 2025-12-05 | 16:15 | inbound | 4,384 | 178 | 16.24% | 20.8 km/h |
| 2025-11-21 | 16:00 | inbound | 4,048 | 190 | 18.77% | 21.0 km/h |
| 2025-12-03 | 16:30 | inbound | 4,744 | 200 | 16.86% | 21.1 km/h |
| 2025-12-12 | 16:15 | inbound | 4,784 | 222 | 18.56% | 21.1 km/h |
| 2025-12-18 | 13:30 | inbound | 4,112 | 248 | 24.12% | 21.1 km/h |
| 2026-02-06 | 16:00 | inbound | 4,380 | 194 | 17.72% | 21.1 km/h |
| 2025-12-05 | 14:30 | inbound | 4,132 | 223 | 21.59% | 21.2 km/h |
| 2025-11-26 | 11:00 | inbound | 4,284 | 327 | 30.53% | 21.3 km/h |
| 2025-12-03 | 15:30 | inbound | 4,276 | 218 | 20.39% | 21.3 km/h |
| 2025-12-12 | 14:30 | inbound | 4,368 | 205 | 18.77% | 21.3 km/h |
| 2025-11-28 | 15:30 | inbound | 4,496 | 190 | 16.90% | 21.4 km/h |
| 2025-11-14 | 16:45 | inbound | 4,516 | 172 | 15.23% | 21.5 km/h |
| 2025-11-21 | 16:30 | inbound | 4,300 | 195 | 18.14% | 21.5 km/h |
| 2025-12-18 | 13:45 | inbound | 4,184 | 276 | 26.39% | 21.5 km/h |
| 2025-12-12 | 15:45 | inbound | 4,716 | 230 | 19.51% | 21.6 km/h |
| 2025-12-18 | 12:45 | inbound | 4,584 | 289 | 25.22% | 21.6 km/h |
| 2025-11-13 | 15:45 | inbound | 4,564 | 226 | 19.81% | 21.7 km/h |
| 2025-11-28 | 11:00 | inbound | 4,144 | 285 | 27.51% | 21.7 km/h |
| 2025-12-17 | 16:00 | inbound | 4,884 | 213 | 17.44% | 21.7 km/h |
Top Baseline Anomalies
Top 25 intervals where actual bridge demand most exceeded the historical baseline for the same weekday and time-bin.
| Date | Time | Direction | Actual VPH | Baseline VPH | Delta VPH | Delta % | Actual Speed | Baseline Speed |
|---|
| 2026-01-01 | 1:15 | outbound | 5,420.0 | 1,125.8 | 4,294.2 | 381.4% | 73.8 km/h | 60.7 km/h |
| 2026-01-01 | 1:30 | outbound | 4,780.0 | 1,017.3 | 3,762.7 | 369.9% | 74.5 km/h | 62.0 km/h |
| 2026-01-01 | 1:00 | outbound | 5,604.0 | 1,295.6 | 4,308.4 | 332.6% | 73.7 km/h | 61.0 km/h |
| 2026-01-01 | 1:45 | outbound | 3,888.0 | 918.0 | 2,970.0 | 323.5% | 74.5 km/h | 62.6 km/h |
| 2026-01-01 | 0:45 | outbound | 5,344.0 | 1,363.3 | 3,980.7 | 292.0% | 73.1 km/h | 60.9 km/h |
| 2026-01-01 | 0:30 | outbound | 5,880.0 | 1,651.1 | 4,228.9 | 256.1% | 72.6 km/h | 61.2 km/h |
| 2026-01-01 | 2:00 | outbound | 3,036.0 | 852.7 | 2,183.3 | 256.1% | 76.1 km/h | 63.0 km/h |
| 2026-01-01 | 2:15 | outbound | 2,612.0 | 745.3 | 1,866.7 | 250.4% | 72.3 km/h | 62.0 km/h |
| 2026-01-01 | 2:30 | outbound | 2,136.0 | 671.6 | 1,464.4 | 218.1% | 77.0 km/h | 62.5 km/h |
| 2026-01-01 | 0:15 | outbound | 5,732.0 | 1,876.0 | 3,856.0 | 205.5% | 71.9 km/h | 60.4 km/h |
| 2026-01-01 | 3:00 | outbound | 1,816.0 | 621.8 | 1,194.2 | 192.1% | 77.0 km/h | 63.1 km/h |
| 2026-01-01 | 2:45 | outbound | 1,920.0 | 662.7 | 1,257.3 | 189.7% | 76.6 km/h | 62.7 km/h |
| 2026-01-01 | 3:15 | outbound | 1,648.0 | 604.0 | 1,044.0 | 172.8% | 77.9 km/h | 63.5 km/h |
| 2026-01-01 | 3:30 | outbound | 1,512.0 | 573.6 | 938.4 | 163.6% | 77.3 km/h | 64.2 km/h |
| 2025-11-17 | 0:30 | outbound | 3,568.0 | 1,390.1 | 2,177.9 | 156.7% | 75.3 km/h | 69.4 km/h |
| 2026-01-01 | 3:45 | outbound | 1,540.0 | 600.8 | 939.2 | 156.3% | 77.4 km/h | 65.2 km/h |
| 2025-11-17 | 0:45 | outbound | 2,740.0 | 1,186.9 | 1,553.1 | 130.8% | 76.0 km/h | 69.8 km/h |
| 2025-11-19 | 22:00 | inbound | 4,644.0 | 2,034.9 | 2,609.1 | 128.2% | 64.9 km/h | 63.5 km/h |
| 2025-11-17 | 0:15 | outbound | 3,528.0 | 1,603.4 | 1,924.6 | 120.0% | 75.5 km/h | 69.1 km/h |
| 2026-01-01 | 4:00 | outbound | 1,480.0 | 687.4 | 792.6 | 115.3% | 77.8 km/h | 66.3 km/h |
| 2025-12-05 | 0:30 | outbound | 3,060.0 | 1,422.7 | 1,637.3 | 115.1% | 71.7 km/h | 59.8 km/h |
| 2025-12-07 | 1:15 | inbound | 1,948.0 | 918.6 | 1,029.4 | 112.1% | 77.0 km/h | 65.4 km/h |
| 2026-02-16 | 5:45 | outbound | 5,136.0 | 2,451.8 | 2,684.2 | 109.5% | 75.2 km/h | 74.4 km/h |
| 2025-11-01 | 0:30 | outbound | 4,864.0 | 2,336.4 | 2,527.6 | 108.2% | 72.6 km/h | 68.4 km/h |
| 2025-12-16 | 10:00 | outbound | 10,484.0 | 5,046.9 | 5,437.1 | 107.7% | 60.2 km/h | 69.0 km/h |
Top Weekday Commuter Anomalies
Top 25 Monday-Friday anomalies between 05:00 and 20:00, to reduce holiday and nightlife distortion.
| Date | Time | Direction | Actual VPH | Baseline VPH | Delta VPH | Delta % | Actual Speed | Baseline Speed |
|---|
| 2026-01-01 | 1:15 | outbound | 5,420.0 | 1,125.8 | 4,294.2 | 381.4% | 73.8 km/h | 60.7 km/h |
| 2026-01-01 | 1:30 | outbound | 4,780.0 | 1,017.3 | 3,762.7 | 369.9% | 74.5 km/h | 62.0 km/h |
| 2026-01-01 | 1:00 | outbound | 5,604.0 | 1,295.6 | 4,308.4 | 332.6% | 73.7 km/h | 61.0 km/h |
| 2026-01-01 | 1:45 | outbound | 3,888.0 | 918.0 | 2,970.0 | 323.5% | 74.5 km/h | 62.6 km/h |
| 2026-01-01 | 0:45 | outbound | 5,344.0 | 1,363.3 | 3,980.7 | 292.0% | 73.1 km/h | 60.9 km/h |
| 2026-01-01 | 0:30 | outbound | 5,880.0 | 1,651.1 | 4,228.9 | 256.1% | 72.6 km/h | 61.2 km/h |
| 2026-01-01 | 0:15 | outbound | 5,732.0 | 1,876.0 | 3,856.0 | 205.5% | 71.9 km/h | 60.4 km/h |
| 2025-11-17 | 0:30 | outbound | 3,568.0 | 1,390.1 | 2,177.9 | 156.7% | 75.3 km/h | 69.4 km/h |
| 2025-11-17 | 0:45 | outbound | 2,740.0 | 1,186.9 | 1,553.1 | 130.8% | 76.0 km/h | 69.8 km/h |
| 2025-11-17 | 0:15 | outbound | 3,528.0 | 1,603.4 | 1,924.6 | 120.0% | 75.5 km/h | 69.1 km/h |
| 2025-12-05 | 0:30 | outbound | 3,060.0 | 1,422.7 | 1,637.3 | 115.1% | 71.7 km/h | 59.8 km/h |
| 2025-12-16 | 10:00 | outbound | 10,484.0 | 5,046.9 | 5,437.1 | 107.7% | 60.2 km/h | 69.0 km/h |
| 2025-12-25 | 1:00 | inbound | 904.0 | 460.9 | 443.1 | 96.1% | 78.8 km/h | 66.0 km/h |
| 2025-12-12 | 0:00 | outbound | 3,740.0 | 1,920.2 | 1,819.8 | 94.8% | 60.6 km/h | 58.1 km/h |
| 2025-12-04 | 0:00 | outbound | 3,408.0 | 1,770.9 | 1,637.1 | 92.4% | 41.7 km/h | 59.8 km/h |
| 2025-12-25 | 0:45 | inbound | 936.0 | 486.9 | 449.1 | 92.2% | 78.8 km/h | 66.1 km/h |
| 2025-11-13 | 0:30 | outbound | 3,132.0 | 1,651.1 | 1,480.9 | 89.7% | 74.0 km/h | 61.2 km/h |
| 2025-12-04 | 0:15 | outbound | 3,556.0 | 1,876.0 | 1,680.0 | 89.6% | 41.5 km/h | 60.4 km/h |
| 2025-12-05 | 0:00 | outbound | 3,612.0 | 1,920.2 | 1,691.8 | 88.1% | 74.3 km/h | 58.1 km/h |
| 2026-01-26 | 0:30 | inbound | 1,104.0 | 587.4 | 516.6 | 88.0% | 78.6 km/h | 68.1 km/h |
| 2026-03-09 | 1:00 | inbound | 804.0 | 435.8 | 368.2 | 84.5% | 79.3 km/h | 69.4 km/h |
| 2025-12-05 | 0:15 | outbound | 3,096.0 | 1,688.6 | 1,407.4 | 83.3% | 73.0 km/h | 58.6 km/h |
| 2025-12-11 | 0:00 | outbound | 3,228.0 | 1,770.9 | 1,457.1 | 82.3% | 60.6 km/h | 59.8 km/h |
| 2026-01-26 | 0:00 | inbound | 1,420.0 | 778.7 | 641.3 | 82.3% | 78.3 km/h | 68.1 km/h |
| 2025-12-05 | 0:45 | outbound | 2,212.0 | 1,230.3 | 981.7 | 79.8% | 73.7 km/h | 60.5 km/h |
Speed by Volume Band
This shows how speed behaves as traffic volume rises.
| Volume Band | Intervals | Avg Speed | Min Speed | Avg Truck % |
|---|
| 0-1999 | 7,177 | 68.7 km/h | 16.7 km/h | 22.06% |
| 2000-3999 | 5,495 | 68.0 km/h | 13.8 km/h | 11.41% |
| 4000-5999 | 9,058 | 68.9 km/h | 19.8 km/h | 17.40% |
| 6000-7999 | 4,016 | 64.1 km/h | 25.7 km/h | 16.78% |
| 8000+ | 21 | 61.4 km/h | 49.9 km/h | 20.00% |
Hourly Bridge Profile
Bridge structure by hour and direction.
| Hour | Direction | Avg VPH | Max VPH | Avg Speed | Intervals |
|---|
| 00:00 | inbound | 795.8 | 2,244 | 66.0 km/h | 536 |
| 00:00 | outbound | 1,833.5 | 5,880 | 65.0 km/h | 532 |
| 01:00 | inbound | 523.7 | 1,996 | 67.6 km/h | 536 |
| 01:00 | outbound | 1,139.2 | 5,604 | 66.8 km/h | 533 |
| 02:00 | inbound | 435.1 | 1,016 | 69.5 km/h | 536 |
| 02:00 | outbound | 813.3 | 3,036 | 68.5 km/h | 532 |
| 03:00 | inbound | 521.2 | 940 | 71.2 km/h | 536 |
| 03:00 | outbound | 666.1 | 1,816 | 69.7 km/h | 533 |
| 04:00 | inbound | 1,034.3 | 2,152 | 73.9 km/h | 536 |
| 04:00 | outbound | 842.9 | 1,480 | 72.7 km/h | 540 |
| 05:00 | inbound | 3,244.2 | 6,688 | 75.1 km/h | 535 |
| 05:00 | outbound | 1,807.1 | 5,168 | 75.6 km/h | 540 |
| 06:00 | inbound | 5,306.0 | 8,248 | 69.8 km/h | 531 |
| 06:00 | outbound | 3,415.0 | 6,136 | 74.9 km/h | 539 |
| 07:00 | inbound | 5,251.6 | 8,252 | 62.0 km/h | 534 |
| 07:00 | outbound | 4,260.4 | 6,876 | 73.2 km/h | 536 |
| 08:00 | inbound | 5,241.7 | 7,956 | 57.2 km/h | 536 |
| 08:00 | outbound | 4,348.1 | 6,584 | 71.5 km/h | 540 |
| 09:00 | inbound | 5,359.3 | 7,684 | 60.5 km/h | 535 |
| 09:00 | outbound | 4,399.7 | 7,480 | 70.2 km/h | 540 |
| 10:00 | inbound | 5,422.4 | 7,304 | 66.9 km/h | 532 |
| 10:00 | outbound | 4,829.3 | 10,484 | 69.4 km/h | 540 |
| 11:00 | inbound | 5,611.9 | 7,432 | 69.0 km/h | 536 |
| 11:00 | outbound | 5,070.6 | 7,056 | 69.3 km/h | 540 |
| 12:00 | inbound | 5,503.4 | 7,420 | 68.5 km/h | 536 |
| 12:00 | outbound | 5,293.6 | 7,100 | 69.0 km/h | 540 |
| 13:00 | inbound | 5,440.3 | 7,576 | 68.5 km/h | 536 |
| 13:00 | outbound | 5,472.0 | 7,000 | 69.0 km/h | 540 |
| 14:00 | inbound | 5,641.4 | 7,648 | 66.8 km/h | 534 |
| 14:00 | outbound | 5,984.3 | 7,760 | 68.0 km/h | 540 |
| 15:00 | inbound | 5,210.8 | 7,068 | 62.0 km/h | 535 |
| 15:00 | outbound | 6,364.0 | 8,304 | 65.2 km/h | 540 |
| 16:00 | inbound | 5,258.7 | 6,848 | 64.8 km/h | 536 |
| 16:00 | outbound | 6,305.2 | 8,132 | 60.3 km/h | 540 |
| 17:00 | inbound | 5,551.1 | 7,580 | 68.3 km/h | 536 |
| 17:00 | outbound | 6,099.8 | 8,300 | 59.2 km/h | 540 |
| 18:00 | inbound | 4,594.3 | 7,728 | 71.8 km/h | 537 |
| 18:00 | outbound | 5,599.0 | 8,168 | 64.9 km/h | 540 |
| 19:00 | inbound | 3,501.7 | 5,596 | 74.6 km/h | 535 |
| 19:00 | outbound | 4,380.4 | 7,628 | 71.1 km/h | 540 |
| 20:00 | inbound | 2,795.1 | 4,768 | 69.6 km/h | 536 |
| 20:00 | outbound | 3,613.4 | 7,328 | 72.6 km/h | 540 |
| 21:00 | inbound | 2,429.7 | 3,828 | 64.9 km/h | 538 |
| 21:00 | outbound | 3,453.8 | 4,976 | 68.8 km/h | 539 |
| 22:00 | inbound | 1,928.1 | 4,644 | 64.3 km/h | 540 |
| 22:00 | outbound | 3,363.0 | 5,624 | 63.5 km/h | 534 |
| 23:00 | inbound | 1,283.3 | 2,904 | 65.4 km/h | 536 |
| 23:00 | outbound | 2,684.4 | 5,452 | 63.2 km/h | 535 |
Day-of-Week Bridge Profile
Bridge structure by weekday and direction.
| Day | Direction | Avg VPH | Max VPH | Avg Speed | Intervals |
|---|
| Monday | inbound | 3,585.8 | 8,032 | 68.9 km/h | 1,821 |
| Monday | outbound | 3,696.4 | 8,160 | 68.8 km/h | 1,813 |
| Tuesday | inbound | 3,653.9 | 8,252 | 67.4 km/h | 1,822 |
| Tuesday | outbound | 3,869.0 | 10,484 | 67.7 km/h | 1,809 |
| Wednesday | inbound | 3,728.4 | 8,124 | 64.7 km/h | 1,811 |
| Wednesday | outbound | 4,005.7 | 8,132 | 67.6 km/h | 1,819 |
| Thursday | inbound | 3,818.5 | 8,144 | 65.0 km/h | 1,744 |
| Thursday | outbound | 4,069.4 | 8,168 | 65.7 km/h | 1,809 |
| Friday | inbound | 3,884.7 | 8,248 | 63.2 km/h | 1,824 |
| Friday | outbound | 4,126.6 | 8,300 | 66.2 km/h | 1,823 |
| Saturday | inbound | 3,734.9 | 7,728 | 70.5 km/h | 1,914 |
| Saturday | outbound | 3,835.4 | 7,428 | 70.9 km/h | 1,920 |
| Sunday | inbound | 3,234.3 | 7,396 | 71.9 km/h | 1,918 |
| Sunday | outbound | 3,319.8 | 7,568 | 71.7 km/h | 1,920 |
WGT Feeder Corridor Summary (Sites 563–568)
Calculated correctly by summing raw class/bin rows to site-heading timestamp totals first, then averaging and taking peaks.
| Site | Heading | Avg VPH | Peak VPH | Total Volume | Intervals |
|---|
| 567 | E | 2,686.1 | 6,572.0 | 5,378,846 | 8,010 |
| 566 | E | 2,438.3 | 5,604.0 | 7,887,769 | 12,940 |
| 565 | E | 2,426.0 | 5,660.0 | 7,848,705 | 12,941 |
| 563 | E | 2,248.5 | 5,248.0 | 6,744,852 | 11,999 |
| 564 | E | 1,347.1 | 3,332.0 | 4,357,839 | 12,940 |
| 568 | E | 1,104.9 | 2,540.0 | 3,574,776 | 12,942 |
| 566 | W | 83.2 | 392.0 | 104 | 5 |
| 565 | W | 38.0 | 172.0 | 95 | 10 |
| 568 | W | 13.5 | 32.0 | 54 | 16 |
| 564 | W | 12.0 | 32.0 | 12 | 4 |
| 563 | W | 8.0 | 8.0 | 2 | 1 |
| 567 | W | 4.0 | 4.0 | 2 | 2 |
Combined WGT Feeder Peak Timestamps
Peak combined feeder pressure across sites 563–568.
| Timestamp | Combined Feeder VPH |
|---|
| 2026-02-03 06:00:00 | 28,308.0 |
| 2026-02-04 06:00:00 | 27,884.0 |
| 2026-02-05 06:00:00 | 27,832.0 |
| 2026-02-12 06:00:00 | 27,760.0 |
| 2026-01-29 06:00:00 | 27,756.0 |
| 2026-02-02 06:00:00 | 27,628.0 |
| 2026-01-15 06:00:00 | 27,584.0 |
| 2026-02-06 06:00:00 | 27,564.0 |
| 2026-01-30 06:00:00 | 27,440.0 |
| 2026-01-20 06:00:00 | 27,348.0 |
| 2026-02-27 06:00:00 | 27,280.0 |
| 2026-01-12 07:15:00 | 27,224.0 |
| 2026-01-21 06:00:00 | 27,180.0 |
| 2026-01-20 07:00:00 | 27,080.0 |
| 2026-01-22 06:00:00 | 27,068.0 |
| 2026-01-16 06:00:00 | 27,060.0 |
| 2026-02-06 06:15:00 | 27,020.0 |
| 2026-01-21 07:30:00 | 26,988.0 |
| 2026-02-11 06:15:00 | 26,960.0 |
| 2026-02-10 06:15:00 | 26,888.0 |
| 2026-01-20 06:15:00 | 26,792.0 |
| 2026-01-22 06:15:00 | 26,736.0 |
| 2026-02-04 07:15:00 | 26,712.0 |
| 2026-02-07 14:30:00 | 26,632.0 |
| 2026-01-21 06:15:00 | 26,596.0 |
Baseline Model Sample
First 40 rows from bridge_baseline to show the structure of the model.
| Direction | Day | Time Bin | Samples | Avg VPH | Median VPH Eq. | P10 VPH Eq. | P90 VPH Eq. | Avg Truck % | Avg Speed |
|---|
| inbound | Sunday | 0:00 | 20 | 1,658.6 | 1,668.0 | 1,350.8 | 2,049.2 | 5.03% | 63.9 km/h |
| inbound | Sunday | 0:15 | 20 | 1,451.4 | 1,486.0 | 1,161.6 | 1,665.6 | 5.31% | 64.3 km/h |
| inbound | Sunday | 0:30 | 20 | 1,320.8 | 1,314.0 | 1,022.0 | 1,453.6 | 5.65% | 64.2 km/h |
| inbound | Sunday | 0:45 | 20 | 1,135.4 | 1,096.0 | 980.4 | 1,343.6 | 5.53% | 64.5 km/h |
| inbound | Sunday | 10:00 | 20 | 4,914.6 | 4,960.0 | 4,400.0 | 5,575.2 | 6.53% | 75.6 km/h |
| inbound | Sunday | 10:15 | 20 | 5,309.2 | 5,498.0 | 4,716.0 | 5,849.6 | 6.25% | 75.1 km/h |
| inbound | Sunday | 10:30 | 20 | 5,651.6 | 5,858.0 | 4,968.8 | 6,175.6 | 6.16% | 74.8 km/h |
| inbound | Sunday | 10:45 | 20 | 5,698.6 | 5,820.0 | 5,107.2 | 6,329.2 | 6.31% | 74.7 km/h |
| inbound | Sunday | 11:00 | 20 | 5,852.2 | 6,000.0 | 5,392.0 | 6,692.8 | 6.35% | 74.5 km/h |
| inbound | Sunday | 11:15 | 20 | 6,198.0 | 6,402.0 | 5,581.2 | 7,148.8 | 6.11% | 74.1 km/h |
| inbound | Sunday | 11:30 | 20 | 6,230.2 | 6,440.0 | 5,795.6 | 7,089.2 | 6.13% | 73.0 km/h |
| inbound | Sunday | 11:45 | 20 | 6,029.6 | 6,268.0 | 5,460.0 | 6,836.0 | 5.86% | 72.3 km/h |
| inbound | Sunday | 12:00 | 20 | 5,925.2 | 6,122.0 | 4,919.2 | 6,684.8 | 6.11% | 70.7 km/h |
| inbound | Sunday | 12:15 | 20 | 5,998.2 | 6,162.0 | 5,352.0 | 6,652.4 | 5.68% | 70.4 km/h |
| inbound | Sunday | 12:30 | 20 | 6,018.8 | 6,170.0 | 5,379.2 | 6,832.0 | 5.80% | 71.5 km/h |
| inbound | Sunday | 12:45 | 20 | 5,699.4 | 5,738.0 | 4,920.0 | 6,702.8 | 6.14% | 73.4 km/h |
| inbound | Sunday | 13:00 | 20 | 5,676.8 | 5,806.0 | 4,871.2 | 6,379.2 | 6.03% | 73.1 km/h |
| inbound | Sunday | 13:15 | 20 | 5,616.2 | 5,866.0 | 4,640.4 | 6,506.8 | 6.18% | 73.2 km/h |
| inbound | Sunday | 13:30 | 20 | 5,584.8 | 5,898.0 | 4,655.2 | 6,212.4 | 6.20% | 73.3 km/h |
| inbound | Sunday | 13:45 | 20 | 5,580.0 | 5,744.0 | 4,856.4 | 6,558.0 | 6.59% | 73.2 km/h |
| inbound | Sunday | 14:00 | 20 | 5,508.6 | 5,702.0 | 4,727.2 | 6,257.2 | 6.43% | 73.2 km/h |
| inbound | Sunday | 14:15 | 20 | 5,488.8 | 5,658.0 | 4,513.2 | 6,316.8 | 5.94% | 72.5 km/h |
| inbound | Sunday | 14:30 | 20 | 5,490.0 | 5,660.0 | 4,772.8 | 6,209.6 | 6.46% | 72.7 km/h |
| inbound | Sunday | 14:45 | 20 | 5,461.6 | 5,620.0 | 4,908.0 | 6,154.0 | 6.20% | 72.3 km/h |
| inbound | Sunday | 15:00 | 20 | 5,292.0 | 5,474.0 | 4,692.8 | 5,786.8 | 6.38% | 73.2 km/h |
| inbound | Sunday | 15:15 | 20 | 5,402.0 | 5,616.0 | 4,788.4 | 6,091.6 | 6.12% | 73.2 km/h |
| inbound | Sunday | 15:30 | 20 | 5,580.4 | 5,674.0 | 4,940.0 | 6,400.8 | 5.92% | 73.0 km/h |
| inbound | Sunday | 15:45 | 20 | 5,418.8 | 5,576.0 | 4,760.4 | 6,106.4 | 6.10% | 72.5 km/h |
| inbound | Sunday | 16:00 | 20 | 5,267.8 | 5,398.0 | 4,707.6 | 5,929.6 | 6.24% | 73.2 km/h |
| inbound | Sunday | 16:15 | 20 | 5,413.6 | 5,620.0 | 4,991.2 | 5,928.0 | 6.02% | 73.4 km/h |
| inbound | Sunday | 16:30 | 20 | 5,557.6 | 5,688.0 | 5,128.0 | 6,261.6 | 5.79% | 73.8 km/h |
| inbound | Sunday | 16:45 | 20 | 5,490.6 | 5,584.0 | 5,070.4 | 6,267.2 | 5.97% | 73.1 km/h |
| inbound | Sunday | 17:00 | 20 | 5,486.8 | 5,600.0 | 4,844.4 | 6,383.6 | 6.04% | 73.5 km/h |
| inbound | Sunday | 17:15 | 20 | 5,582.6 | 5,770.0 | 5,000.4 | 6,441.6 | 5.80% | 73.3 km/h |
| inbound | Sunday | 17:30 | 20 | 5,560.8 | 5,526.0 | 5,010.0 | 6,450.4 | 5.73% | 72.9 km/h |
| inbound | Sunday | 17:45 | 20 | 5,200.8 | 5,352.0 | 4,601.2 | 6,161.2 | 6.15% | 73.2 km/h |
| inbound | Sunday | 18:00 | 20 | 4,810.4 | 4,828.0 | 4,386.4 | 5,456.8 | 6.50% | 73.6 km/h |
| inbound | Sunday | 18:15 | 20 | 4,683.6 | 4,604.0 | 4,242.8 | 5,492.0 | 6.54% | 73.3 km/h |
| inbound | Sunday | 18:30 | 20 | 4,361.0 | 4,272.0 | 3,856.0 | 5,006.8 | 6.57% | 74.3 km/h |
| inbound | Sunday | 18:45 | 20 | 3,961.0 | 3,980.0 | 3,163.2 | 4,648.0 | 6.47% | 74.7 km/h |
Detected Schema
bridge_15min
ts_local, date_local, time_bin, direction, site, heading, vehicles_15m, vehicles_per_hour, truck_15m, truck_pct, avg_speed_kmh, row_count
bridge_baseline
direction, day_of_week, time_bin, sample_count, avg_vehicles_15m, median_vehicles_15m, p10_vehicles_15m, p90_vehicles_15m, avg_vehicles_per_hour, avg_truck_pct, avg_speed_kmh
tirtl_raw
raw_id, source_file_id, ts_local, date_local, time_bin, site, heading, vehicle_class, speed_bin, volume
Methodology
This analysis is based on raw TIRTL (Traffic Infrared Traffic Logger) data collected across the West Gate Bridge corridor.
All statistics are generated directly from the underlying dataset without manual adjustment.
Data Source
- Database:
westgate_tirtl.db
- Total records: 132,389,534
- Date range: 1 Nov 2025 → 15 Mar 2026
- Coverage: 302 traffic monitoring sites
Processing Method
- Raw detections aggregated into 15-minute intervals
- Converted to vehicles per hour (VPH) for comparability
- Separated by inbound and outbound bridge direction
- Truck share calculated from classified vehicle data
Baseline Model
A time-aware baseline was constructed using historical averages for each
day-of-week and 15-minute time interval.
- Each interval compared against its historical equivalent
- Allows detection of abnormal traffic demand
- Used to identify peak anomalies and congestion events
Definitions
- Vehicles/hour (VPH): Standardised flow rate derived from 15-minute counts
- Baseline: Expected traffic for the same day and time
- Anomaly: Deviation from baseline conditions
- Truck %: Share of heavy vehicles in total flow
Limitations
- Sensor-based system — subject to normal measurement variation
- Analysis period limited to Nov 2025 → Mar 2026
- External factors (incidents, weather) not explicitly modelled