
Share this traffic analysis page with your friends!
What has just happened?
The Department of Transport has released vehicle counts for the West Gate Bridge and other roads in Victoria in its TIRTL dataset.
The dataset is extremely comprehensive There are more than 132 million travel events in the dataset covering the period from November 2025 until March 2026.
I have now created a database on the West Gate Bridge live stream server containing all of this data. A new overlay has also been added to the live stream called West Gate Bridge Time Machine.
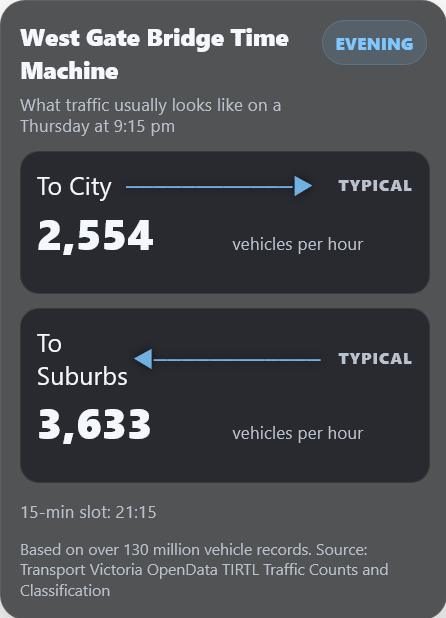
Time Machine gives an indication of what traffic usually looks like at whatever time of day you're looking at the stream. So you can now see the typical number of vehicles per hour travelling into the city and out to the suburbs.
Why might you like to know this?
So you can determine how busy your commute home or to work will likely be.
Headline takeaways
Total travel events analysed
132+ million
Bridge intervals analysed
25,767
Average bridge speed
67.9 km/h
Slowest recorded interval
13.8 km/h
Average bridge flow
3,751 veh/hr
Peak bridge flow
10,484 veh/hr
West Gate Bridge data summary
Independent analysis of more than 132 million traffic records from Transport Victoria’s TIRTL dataset shows the West Gate Bridge is operating under consistently heavy demand, with clear periods of serious stress rather than just occasional congestion.
The bridge-focused dataset contains 25,767 fifteen-minute intervals between 1 November 2025 and 15 March 2026. Across that period, the bridge averaged about 3,751 vehicles per hour, but peak demand reached 10,484 vehicles per hour. Median bridge flow was 4,080 vehicles per hour, and the 95th percentile was 6,872 vehicles per hour, showing that heavy traffic is not rare.
Speed data shows the bridge can deteriorate sharply under pressure. Average speed across all intervals was 67.9 km/h, but the slowest recorded interval dropped to just 13.8 km/h. The median speed was 73.9 km/h, while the 10th percentile was 44.1 km/h, indicating a long tail of poor-performing periods.
The direction split shows outbound traffic is slightly heavier overall than inbound. Outbound traffic averaged 3,842 vehicles per hour and reached the dataset’s maximum of 10,484 vehicles per hour, while inbound averaged 3,659 vehicles per hour with a peak of 8,252 vehicles per hour.
What the hourly pattern shows
The hourly pattern is clear. Inbound traffic is strongest through the morning commute, especially around 6:00 to 10:00, while outbound traffic becomes dominant from the afternoon into the evening, particularly from about 15:00 to 18:00.
Friday is the heaviest regular weekday in both directions, while weekends are lighter and generally faster.
If you can wait until after 10am to travel inbound on a weekday, conditions are usually much better.
Outbound traffic typically clears relatively quickly after 7pm.
How often traffic goes above normal
When compared with the bridge’s own historical baseline for the same weekday and 15-minute slot:
- 24.5% of intervals were more than 10% above normal
- 8.3% were more than 20% above normal
- 3.6% were more than 30% above normal
That indicates unusually heavy demand is common enough to matter operationally.
System-driven congestion, not just one road
The upstream feeder corridor data also supports the view that bridge congestion is system-driven, not the result of one single approach road.
West Gate Tunnel approach roads all carry significant eastbound traffic, with the busiest feeder averaging 2,686 vehicles per hour and peaking at 6,572 vehicles per hour. Combined feeder pressure exceeded 28,000 vehicles per hour at the busiest timestamps, reinforcing the idea that the bridge is acting as a convergence point for multiple traffic streams.
Plain-English takeaway
It is a high-demand corridor that regularly operates under sustained pressure, with clear signs of reduced reliability and severe slowdowns during stressed periods.
The evidence points to congestion being driven by the combined load of the wider road network, rather than a single isolated bottleneck.
Where to go next
I have done a full statistical analysis of the new data here:
https://spotswoodtrailers.com.au/westgate_statsV8.html
You can also use the live West Gate Bridge stream and the new Time Machine overlay to compare current traffic conditions with what is typical for that time of day.